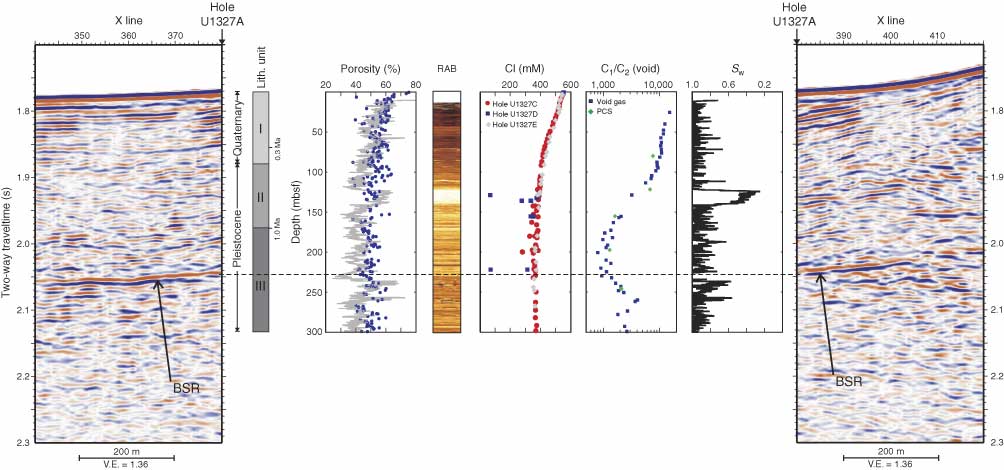
Figure F16. Comparison of seismic data from Inline 38 and key data from Site U1327, including lithostratigraphic units (Hole U1327C), porosity from LWD/MWD data (Hole U1327A) and MAD data (Hole U1327C), resistivity-at-the-bit (RAB) data from LWD/MWD (Hole U1327A), interstitial water chlorinity (Hole U1327C), C1/C2 ratio (Hole U1327C), and pore water saturation (Sw) from LWD data (Hole U1327C). Note that there is an offset of ~15 m between Holes U1327A and U1327C in a direction perpendicular to the orientation of Inline 38. The bright band of high electrical reflectivity as seen in the RAB image (identified in Hole U1327A) does not correlate to a prominent seismic event. PCS = pressure core sampler, BSR = bottom-simulating reflector, V.E. = vertical exaggeration.
Previous | Close | Next | Top of page