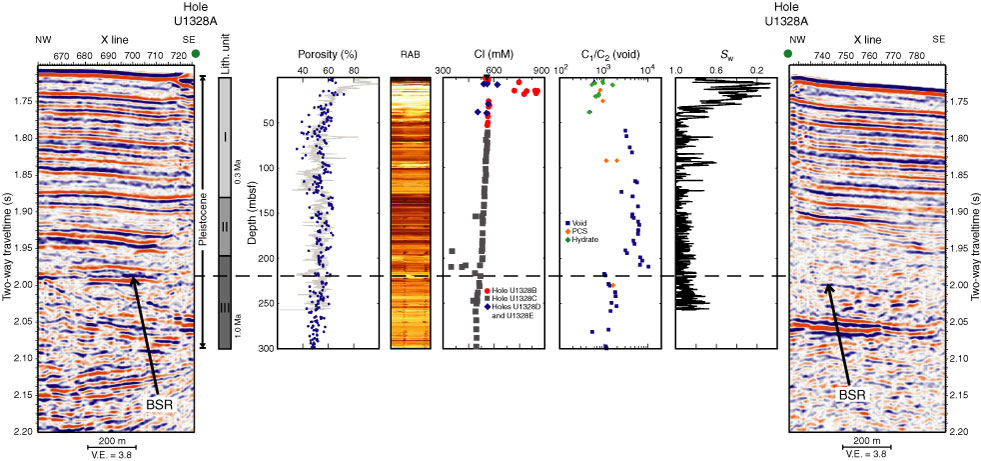
Figure F19. Comparison of major downhole measurements with seismic section from Inline 27 of the 1999 MCS pseudo-3-D data set crossing at Hole U1328A. Shown are lithostratigraphic units and age determination, porosity from LWD and MAD analyses, resistivity-at-the-bit (RAB) image of LWD resistivity, pore water chlorinity, C1/C2 ratio of the void gas, and pore water saturation (Sw) derived from LWD data using Archie's law. Solid triangle = seawater Cl, BSR = bottom-simulating reflector, PCS = pressure core sampler, V.E. = vertical exaggeration.
Previous | Close | Next | Top of page