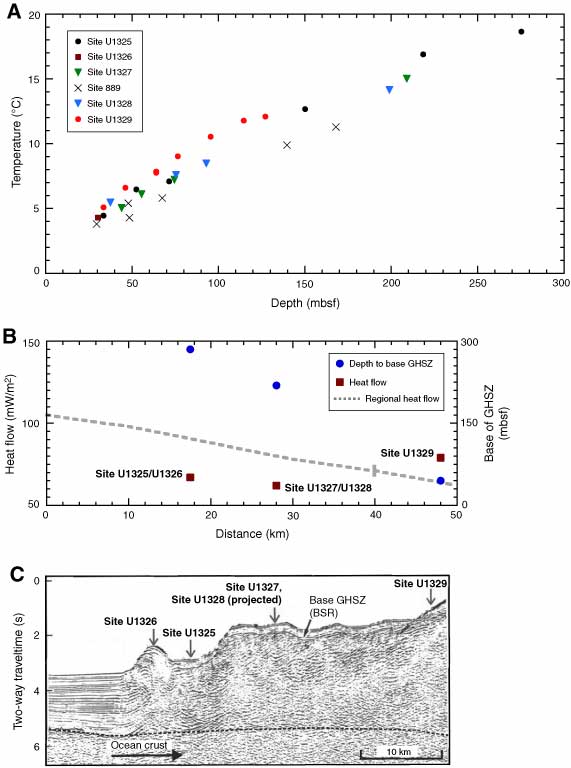
Figure F26. A. All reliable in situ temperature measurements obtained during Expedition 311. Data from ODP Leg 146 Site 889 are also included. B. Regional heat flow trend (dashed line; Hyndman and Wang, 1993) compared to heat flow estimated at Sites U1325–U1329 assuming a thermal conductivity value of 1.1 W/(m·K). The depth to the base of the gas hydrate stability zone (GHSZ) implied by the temperature measurements is also shown. C. Seismic transect across the margin showing the structural setting of the Expedition 311 sites. BSR = bottom-simulating reflector.
Previous | Close | Next | Top of page