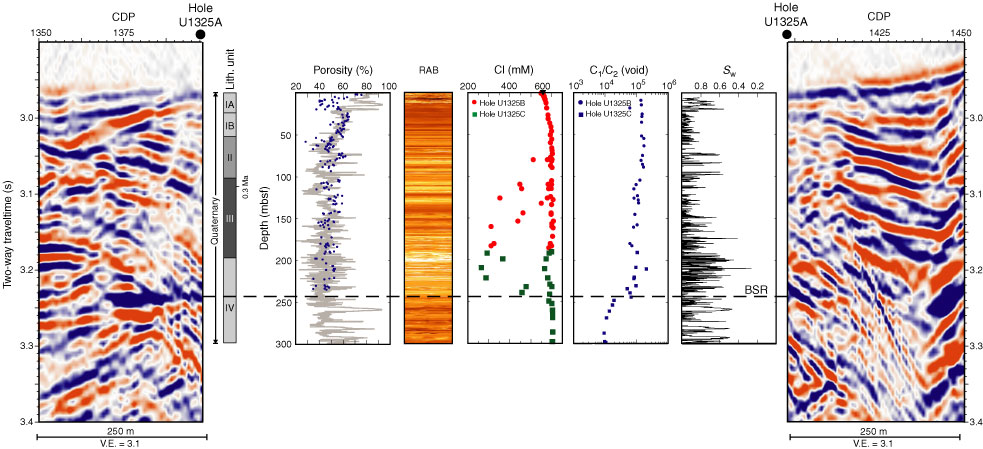
Figure F8. Comparison of seismic data from MCS Line 89-08 nearest to Site U1325 and main logging- and core-derived measurements (porosity from LWD/MWD and MAD data, resistivity-at-the-bit [RAB] image from LWD/MWD deployment, chlorinity of interstitial water samples, C1/C2 ratio of the void gas, and pore water saturation [Sw] from LWD/MWD resistivity data). Solid triangle = seawater Cl, CDP = common depth point, BSR = bottom-simulating reflector, V.E. = vertical exaggeration.
Previous | Close | Next | Top of page