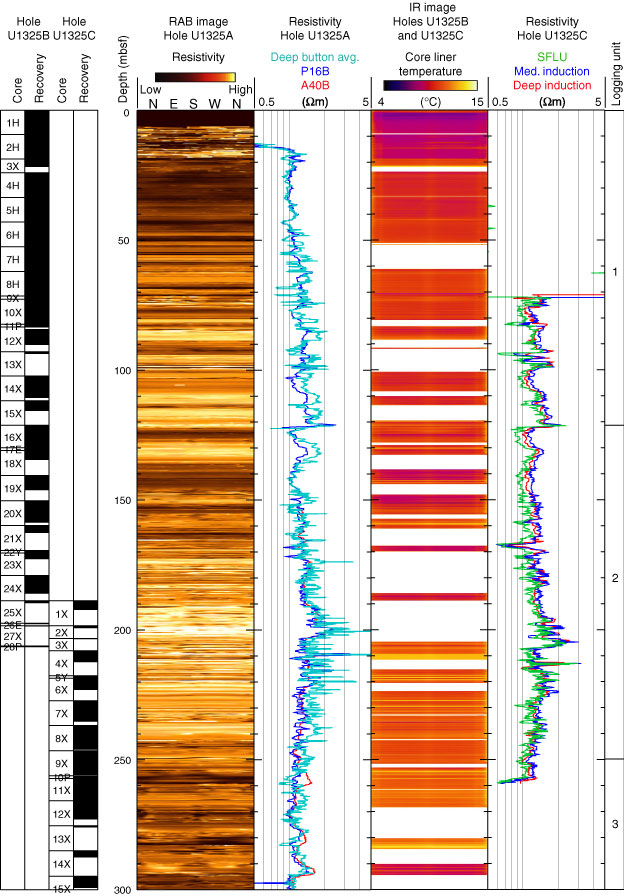
Figure F59. Comparison between LWD resistivity (Hole U1325A), wireline resistivity (Hole U1325C), and infrared (IR) images (Holes U1325B and U1325C). Note that the IR images for 0–189 mbsf are from Hole U1325B, and the IR images for 189–300 mbsf are from Hole U1325C. RAB = resistivity-at-the-bit, avg = average, P16B = EcoScope phase-shift resistivity, A40B = EcoScope attenuation resistivity, SFLU = spherically focused resistivity, Med = medium.
Previous | Close | Next | Top of page