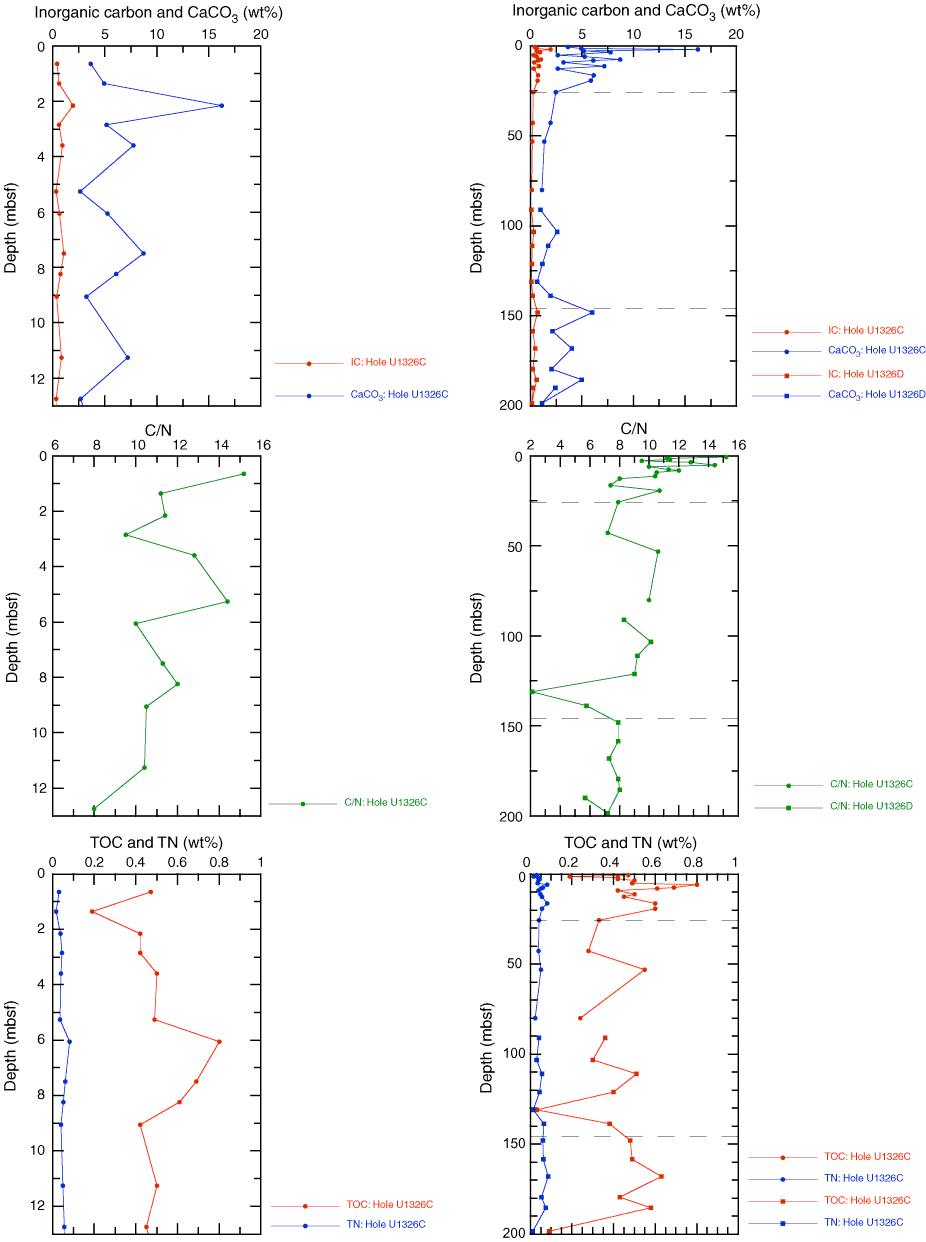
Figure F30. Concentrations of inorganic carbon (IC), calcium carbonate (CaCO3), total organic carbon (TOC), total nitrogen (TN), and C/N ratios in sediments from Site U1326. Data are plotted on different depth scales to highlight the overall site (0–200 mbsf) and near-surface (0–13 mbsf) trends. Dashed lines = lithostratigraphic unit boundaries.
Previous | Close | Next | Top of page