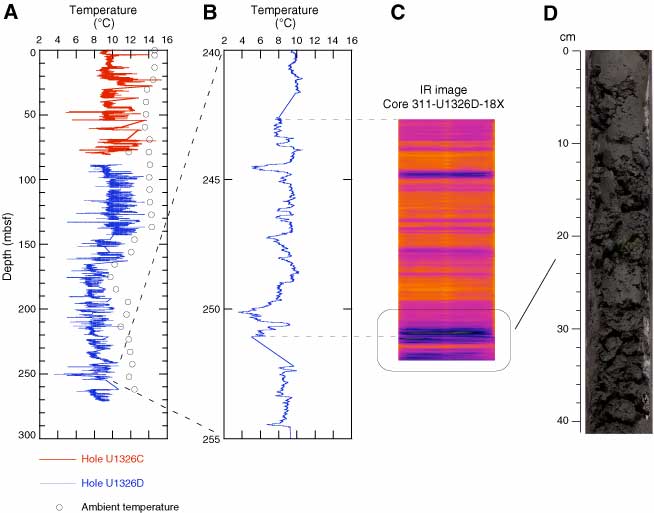
Figure F33. A. Downhole temperatures based on concatenation of core liner temperatures averaged across each pixel row (see text for details). B. Detail of the temperature profile for 240–255 mbsf. Note the numerous, strong cold temperature anomalies. C. Infrared (IR) image of Core 311-U1326D-18X. D. Section 311-U1326D-18X-4 showing "foamy" sediment. The liner was split to expose the whole-round core. Note the shrinkage of the core. This sediment was unusually dry and full of tiny gas bubbles.
Previous | Close | Next | Top of page