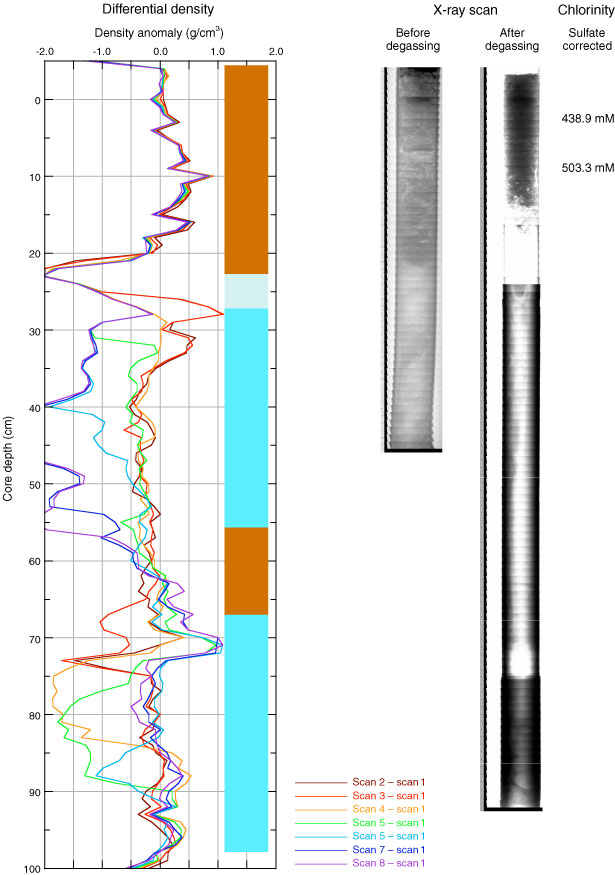
Figure F46. Summary of data collected from Core 311-U1326C-12P, including gamma ray density scans collected during degassing, X-ray images collected before degassing, and chlorinity data collected in selected zones after core extrusion. Gamma ray density scans were shown as differential density plots (i.e., as profiles from which the initial profile has been subtracted). The colored boxes indicate the initial state of the core before degassing (brown = sediment, blue = water, light green = gas).
Previous | Close | Next | Top of page