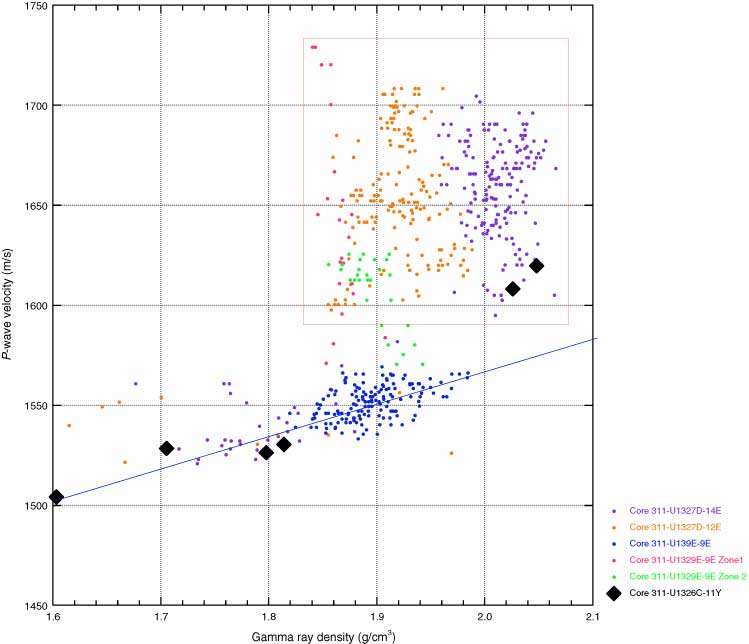
Figure F48. Gamma ray density vs. P-wave velocity for Core 311-U1326C-11Y. Data are also for Cores 311-U1327D-12E, 14E, and 311-U1329E-9E, with the two interpreted gas hydrate–containing intervals highlighted in pink and green. The best-fit line to points showing a "normal" positive correlation between density and P-wave velocity is shown in blue. The red box encompasses anomalous high-velocity points.

Previous | Close | Next | Top of page