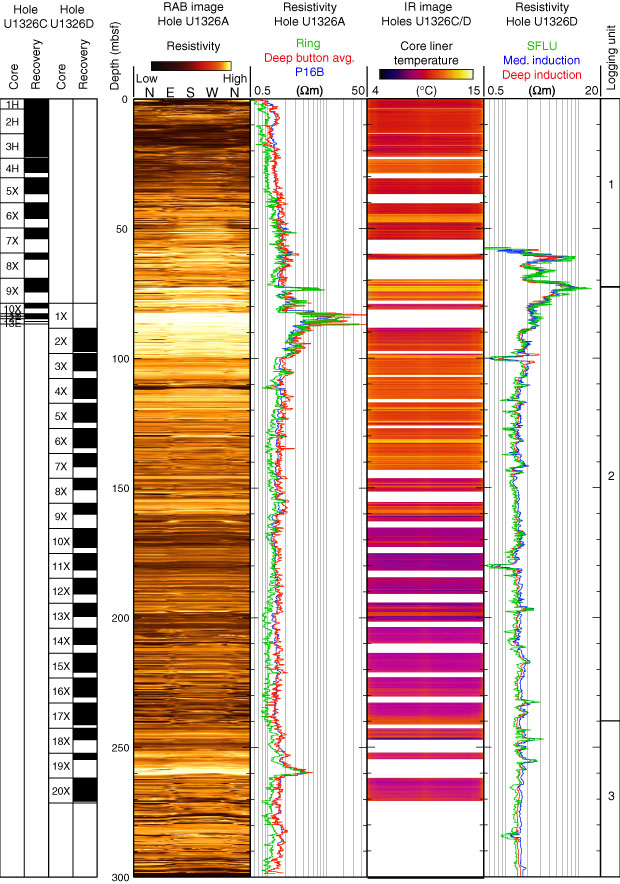
Figure F58. Comparison between LWD resistivity (Hole U1326A), wireline resistivity (Hole U1326D), and infrared (IR) images (Holes 1326C and 1326D). Note that the IR images from 0 to 88.4 mbsf are from Hole U1326C, and the IR images from 88.4 to 300 mbsf are from Hole U1326D. RAB = resistivity-at-the-bit image obtained by the GeoVISION tool, P16B = EcoScope phase-shift resistivity, avg. = average, SFLU = spherically focused resistivity, Med. = medium. White areas in the IR image indicate zones of no core recovery.
Previous | Close | Top of page