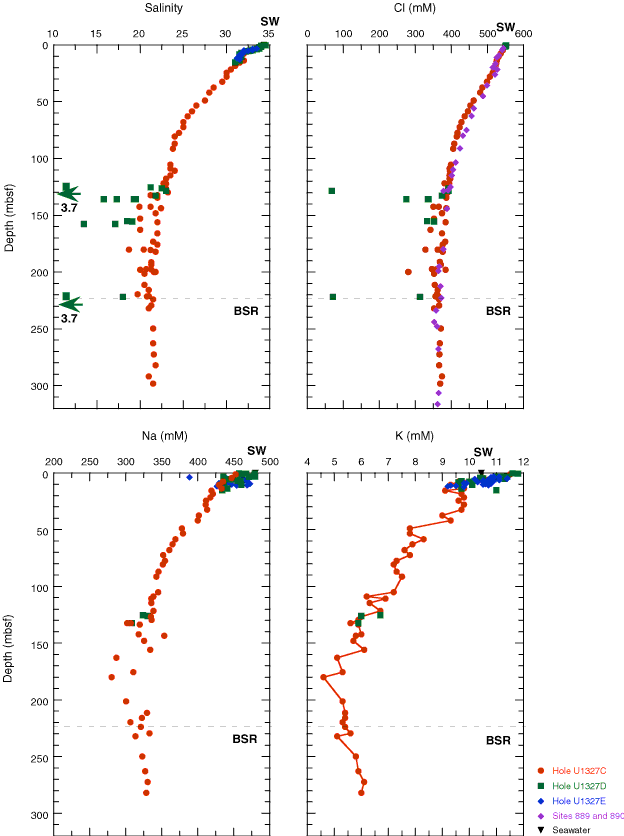
Figure F22. Concentration vs. depth profiles of salinity, chloride, sodium, and potassium in interstitial waters from Holes U1327C, U1327D, and U1327E. For comparison, dissolved chloride data from Sites 889 and 890 are included (data from Westbrook, Carson, Musgrave, et al., 1994). SW = seawater, BSR = seismically inferred bottom-simulating reflector.

Previous | Close | Next | Top of page