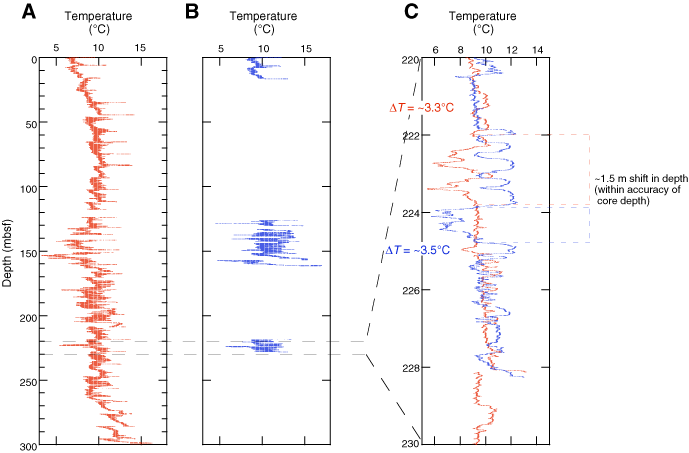
Figure F36. A. Downhole temperature in Hole U1237C based on concatenation of core liner temperatures averaged across each pixel row (see text for details). B. Downhole temperature in Hole U1327D. C. Detail of the temperature profile for 220–230 mbsf. Note the numerous, strong cold temperature anomalies.

Previous | Close | Next | Top of page