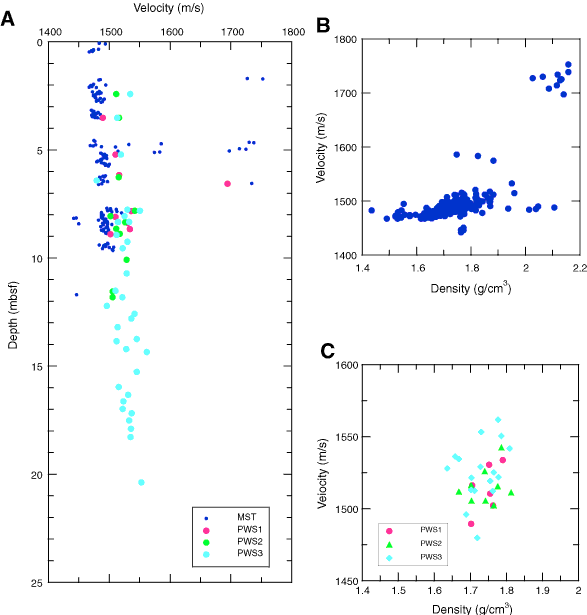
Figure F40. A. P-wave velocity measurements made using the multisensor track (MST) and Hamilton frame at Holes U1327B and U1327C. Only MST and P-wave sensor (PWS) 3 data were used to determine the best-fit line representing velocity as a function of depth beneath the seafloor. B. Comparison of MST velocity and density from Hole U1327B and U1327C. Compared values are within 2 cm of each other. C. Comparison of Hamilton frame velocity and MST density. Compared values are within 2 cm of each other.

Previous | Close | Next | Top of page