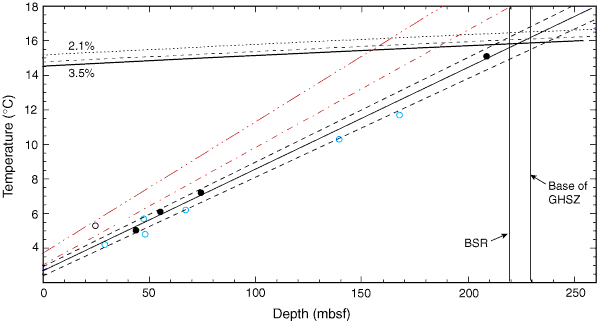
Figure F45. In situ temperature measurements from Site U1327 (black circles; open black circle is a data point that was seriously affected by ship heave and was not used in the calculation of the slope) and Site 889 (blue circles). The best-fit line for the Site U1327 data is shown by the black line, with uncertainties shown by dashed black lines. The slope is 0.059° ± 0.002°C/m with a seafloor intercept of 2.66° ± 0.19°C. For the combined Sites U1327 and 889 best-fit line, the slope is 0.055° ± 0.004°C/m with a seafloor intercept of 2.62° ± 0.38°C. The seafloor intercept is consistent with regional hydrographic data (see "Physical properties" in the "Site U1329" chapter), which indicate that the water temperature at the seafloor is 2.5°–2.8°C. The dashed red lines are the results for Site U1329. Stability boundaries for gas hydrate at hydrostatic pressure for pore water salinities of 2.1%, 3.0%, and 3.5% are also shown (calculated using CSMHY; Sloan, 1998). At this site, background pore water salinity is ~2.1 (see "Interstitial water geochemistry"). Depth of the bottom-simulating reflector (BSR) was predicted from seismic data as described in the "Methods" chapter. Base of gas hydrate stability zone (GHSZ) estimated from thermal gradient at 3.5% salinity.
Previous | Close | Next | Top of page