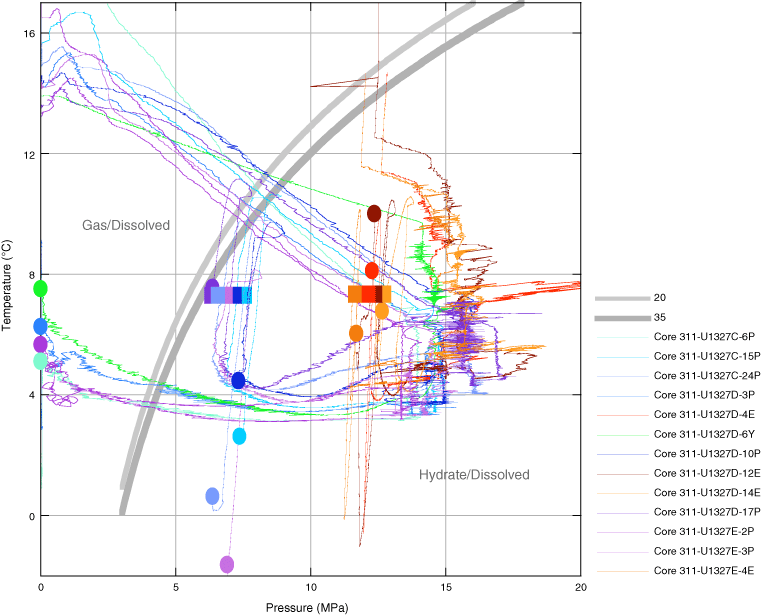
Figure F48. Temperature vs. pressure for all pressure core deployments, showing trajectories relative to gas hydrate stability at 20 and 35 ppt salinity (Xu, 2002, 2004). Circles = final temperature and pressure of autoclave prior to data logger removal, squares = pressure and temperature conditions in the cold laboratory van. No data are available for Core 311-U1327D-13Y.

Previous | Close | Next | Top of page