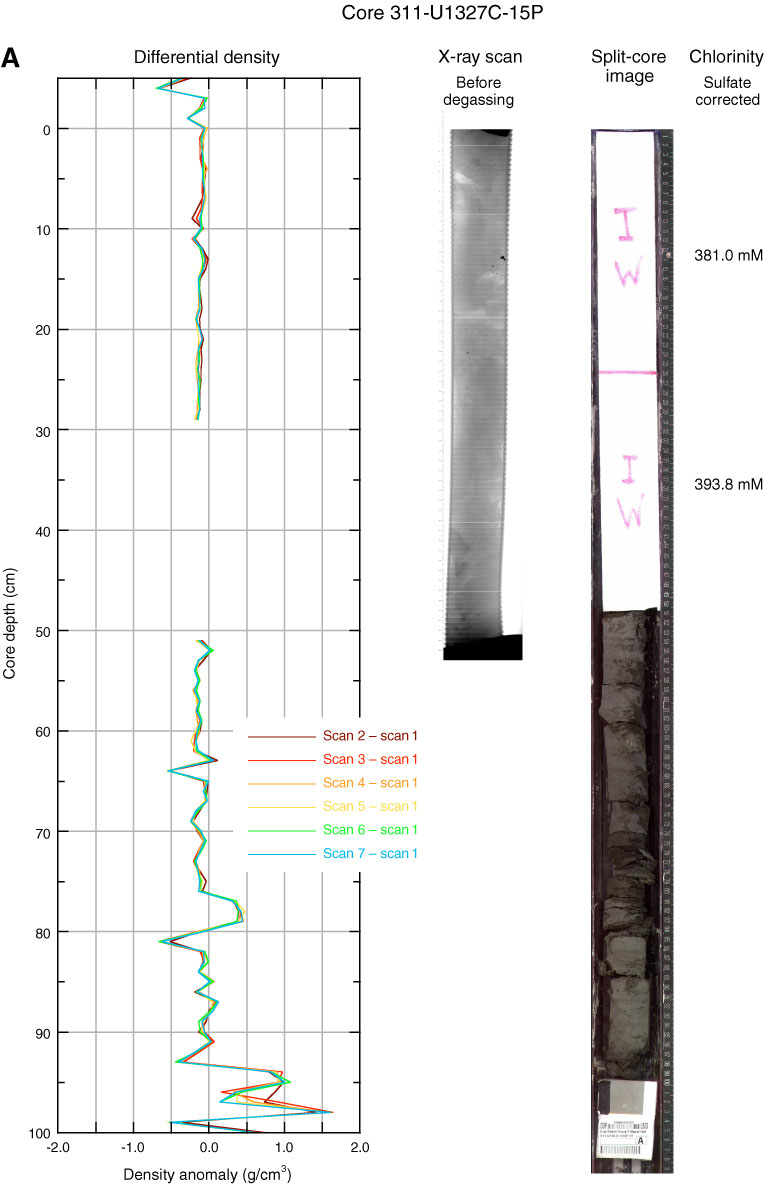
Figure F51. Summary of data collected from PCS cores at Site U1327, including gamma ray density scans collected during degassing, X-ray images collected before and after degassing, line scan images collected after degassing, and chlorinity data collected in selected zones. Gamma ray density scans are shown as differential density plots (i.e., as profiles from which the initial profile has been subtracted). A. Core 311-U1327C-15P. (Continued on next four pages.)
Previous | Close | Next | Top of page