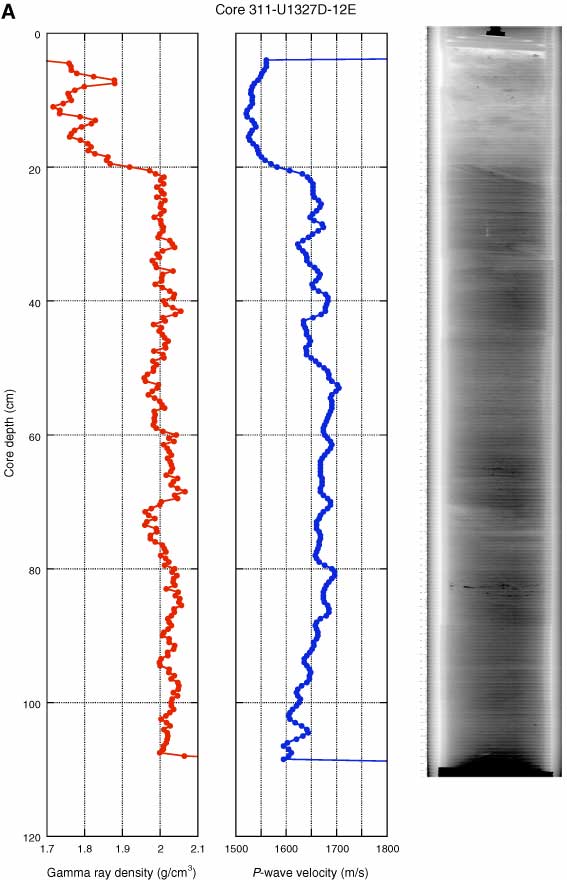
Figure F52. Pressure core data collected at 12 MPa and 7°C, including gamma ray density, P-wave velocity, and X-ray images. X-ray images have been stretched 250% in the cross-core direction to show detail. A. Core 311-U1327D-12E. (Continued on next page.)
Previous | Close | Next | Top of page