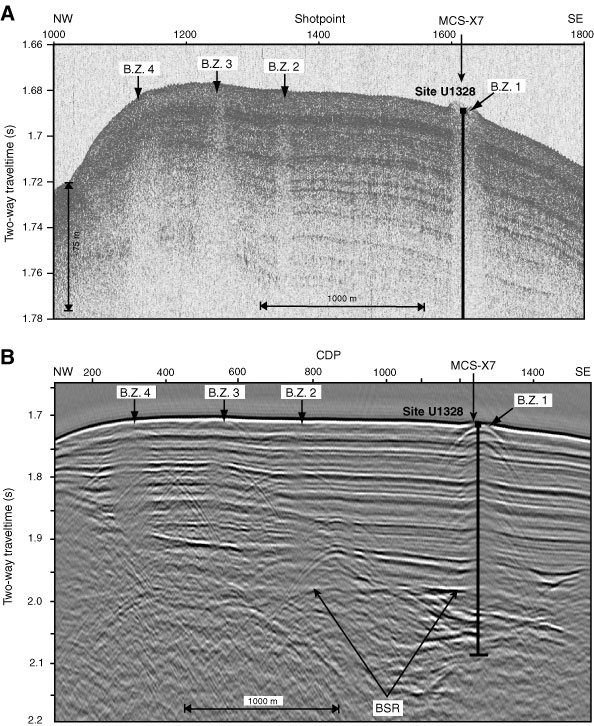
Figure F1. (A) 3.5 kHz subbottom profiler data and (B) multichannel seismic (MCS) data along Inline 27 of the 1999 3-D survey. Note distinct seafloor expression at blank Zone 1 and strong edge–diffractions from the boundaries of the blank zones (from Riedel, 2001). BSR = bottom-simulating reflector, B.Z. = blank zone, CDP = common depth point.
Close | Next | Top of page