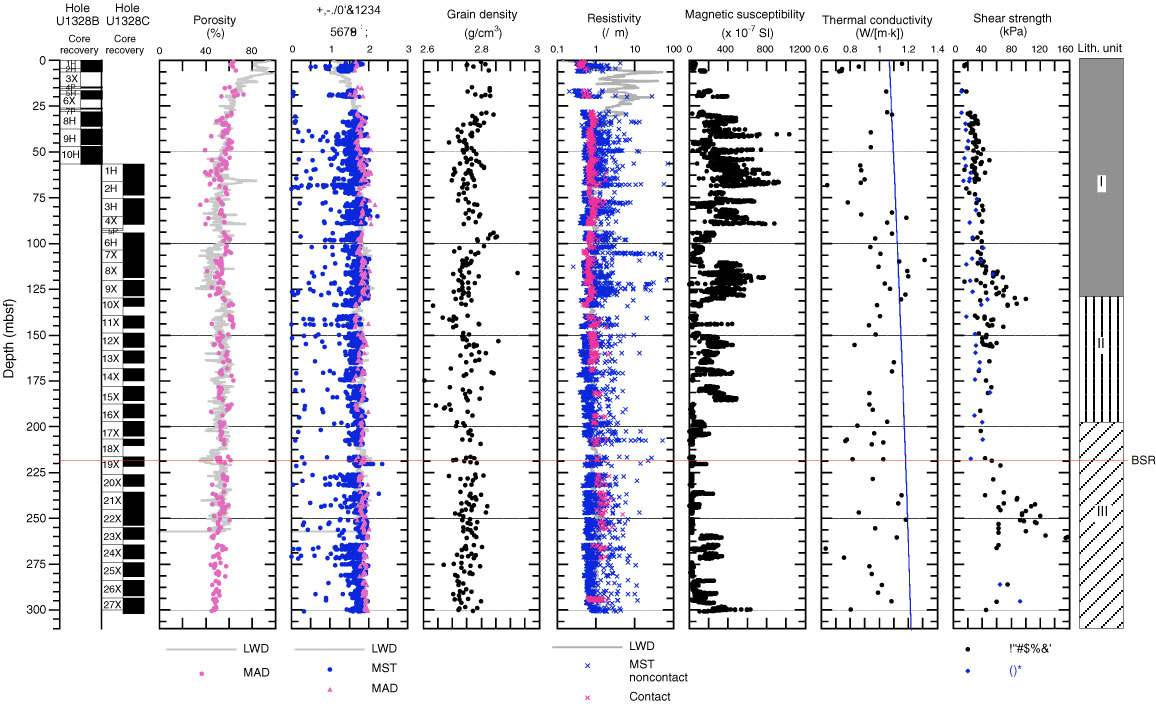
Figure F37. Overview of physical property data from Site U1328. Line in thermal conductivity plot shows regional trend from Davis et al., 1990. LWD = logging while drilling, MAD = moisture and density, MST = multisensor track, AVS = automated vane shear, BSR = bottom-simulating reflector.

Previous | Close | Next | Top of page