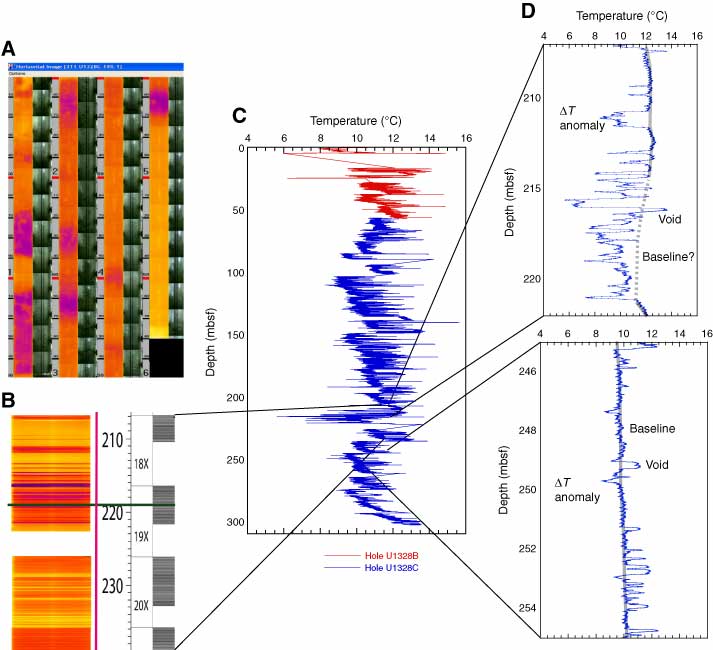
Figure F39. A. Portion of the IR image of Core 311-U1328C-19X taken on the catwalk. These images are used to quickly identify samples that may contain gas hydrate or fresh water released by gas hydrate dissociation during core recovery. B. IR images from several cores concatenated into an IR downhole profile. The presence of an image where there is no core recovery reflects the fact that voids in the core liner are compressed after the IR image is taken but prior to assignment of curated core lengths. As a result, the curated depth relative to the top of a core can be different from depth recorded on the catwalk IR image. C. Downhole temperature profile for Holes U1328B and U1328C based on concatenation of core liner temperatures averaged across each pixel row (see text for details). D. Detailed downhole temperature profiles for two segments of Hole U1328C. An approximate no–gas hydrate, no-void baseline is shown, as are anomalies that are interpreted to be caused by gas hydrate (negative anomalies) or voids (positive anomalies).

Previous | Close | Next | Top of page