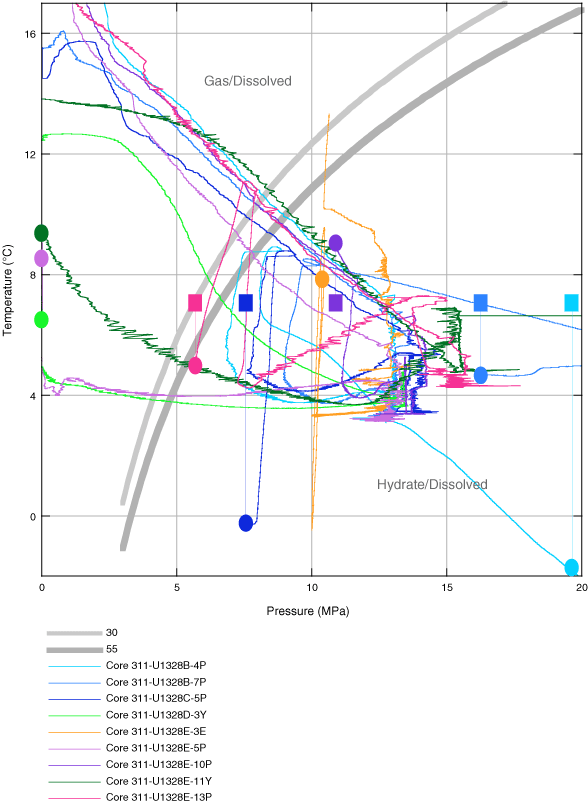
Figure F50. Temperature vs. pressure for all pressure core deployments, showing trajectories relative to gas hydrate stability at 30 and 55 ppt salinity (Xu, 2002, 2004). No data are available for Cores 311-U1328E-7Y and 12E. Circles = final temperature and pressure of autoclave prior to data logger removal, squares = pressure and temperature conditions in the cold laboratory van.

Previous | Close | Next | Top of page