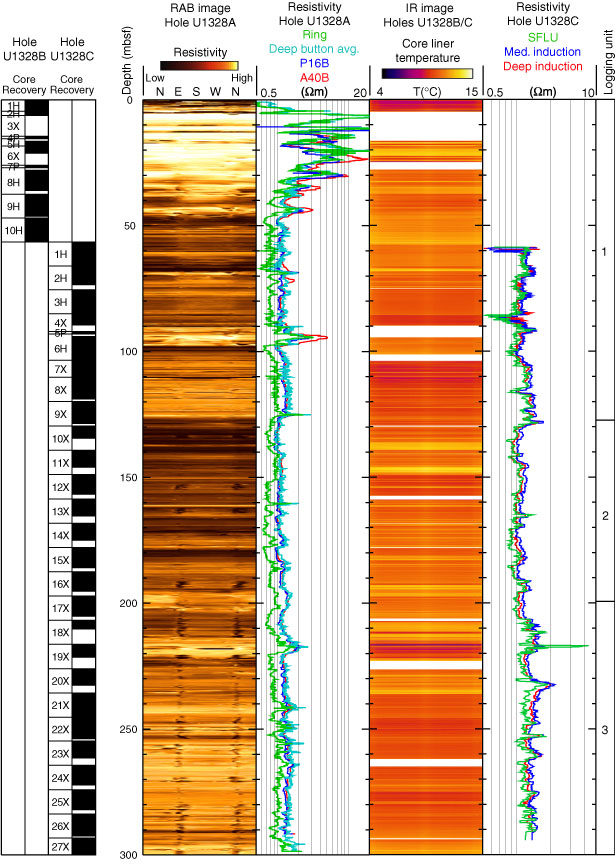
Figure F65. Comparison between LWD and wireline resistivity and infrared (IR) images from Holes U1328A and U1328C. IR images from the seafloor to 56.5 mbsf are from Hole U1328B, and IR images from 56.5 to 300 mbsf are from Hole U1328C. RAB = resistivity-at-the-bit image obtained by the GeoVISION tool, avg. = average, P16B = phase-shift resistivity measured by the EcoScope tool at a source-receiver spacing of 16 inch (41 cm), A40B = attenuation resistivity measured by the EcoScope tool at a source-receiver spacing of 40 inch (102 cm), SFLU = spherically focused resistivity, Med. = medium.
Previous | Close | Next | Top of page