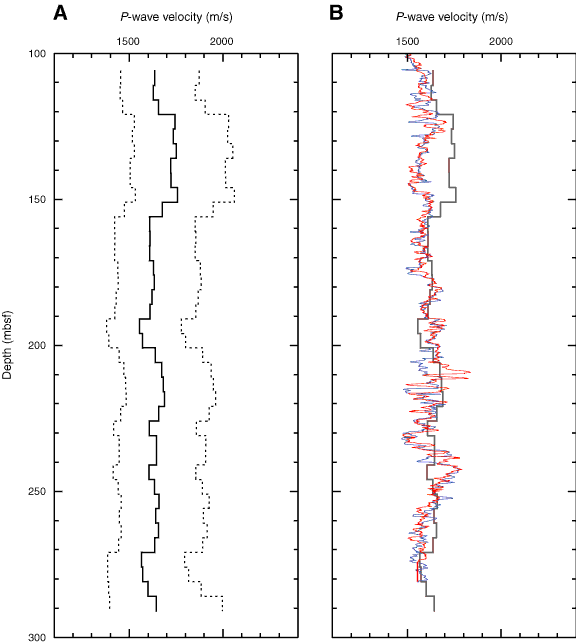
Figure F68. A. Interval velocity inversion of the first break times in the Hole U1328C vertical seismic profile. B. Comparison of the inversion results with the P-wave velocity sonic logs from Hole U1328C (red and blue). Dashed lines = ±1 posterior standard deviation.

Previous | Close | Top of page