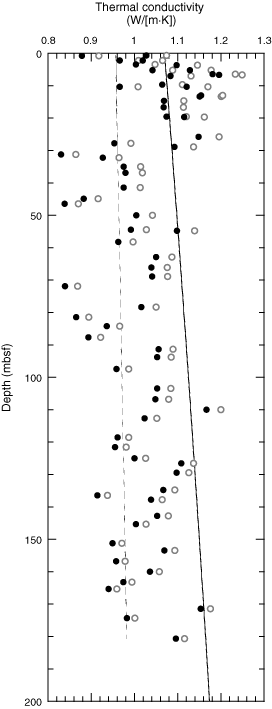
Figure F39. Thermal conductivity from Holes U1329B, U1329C, and U1329E. Values were corrected for in situ temperature and pressure using the equation of Pribnow et al. (2000). Open circles = uncorrected values, solid circles = corrected values, dashed line = correction factor, solid line = regional trend derived by Davis et al. (1990).
Previous | Close | Next | Top of page