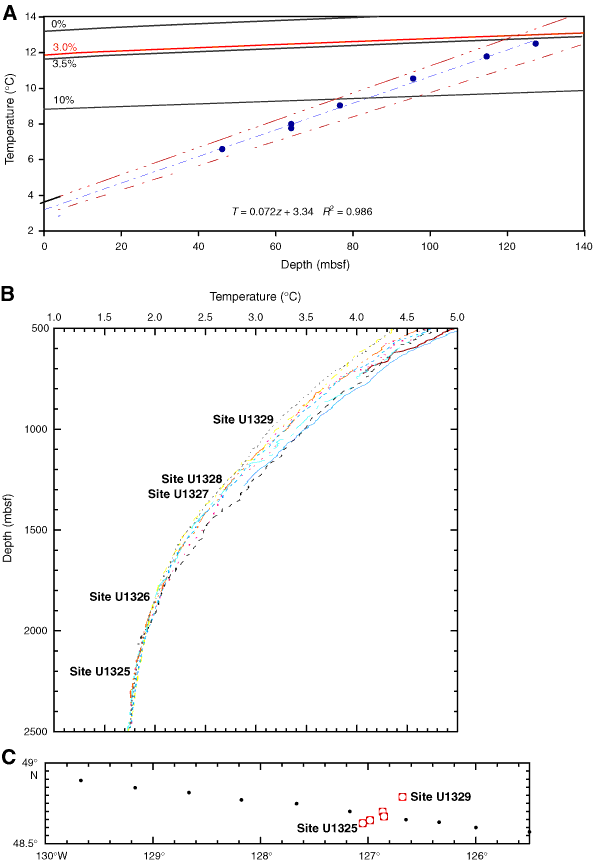
Figure F41. A. Geothermal gradient at Site U1329. Approximate uncertainty limits are shown by dashed red lines. Uncertainties on the slope and intercept of the best-fit line are given in the text. The stability boundary for methane hydrate at hydrostatic pressure is shown (calculated using CSMHY; Sloan, 1998) for water with salinities of 0%, 3.5%, and 10%. B. Seawater temperature from hydrographic profiles for the locations shown in C. Data were collected during Cruise PR06_18DD9309 in May 1993 and obtained from www.ewoce.org in September 2005. The depths of the drill sites are indicated. C. Location of drill sites (red squares) and hydrographic stations (black circles).

Previous | Close | Next | Top of page