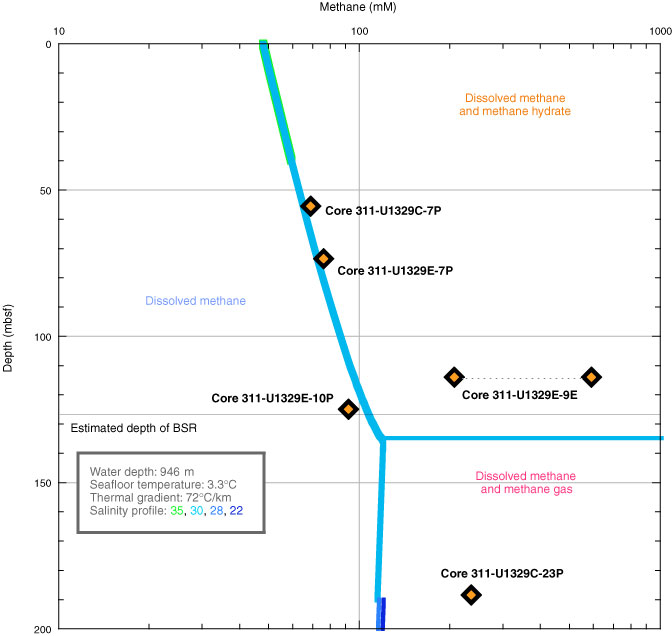
Figure F45. Methane phase diagram, with total methane concentration measured from the four degassed PCS cores and one degassed HRC core at Site U1329. Methane concentration for Core 311-U1329E-9E is shown based on the entire core pore volume (yellow) and the pore volumes of the high-velocity zones (orange). The seafloor temperature and thermal gradient were taken from "In situ temperature profile," the salinity profile was taken from Table T3, and methane saturation was calculated according to Xu (2002, 2004). BSR = bottom-simulating reflector.
Previous | Close | Next | Top of page