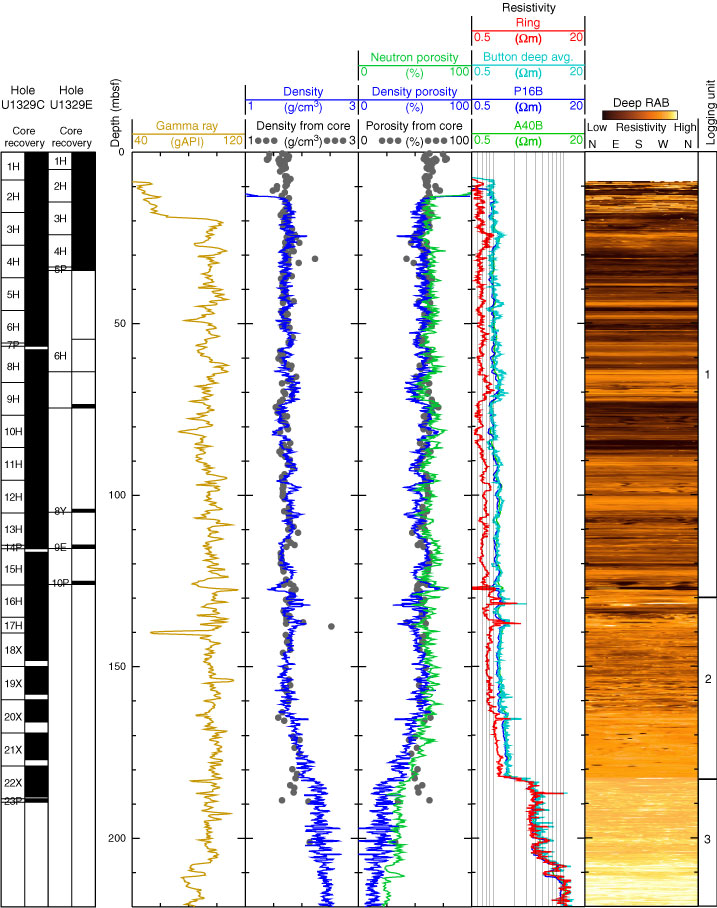
Figure F53. Summary of LWD data from Hole U1329A. avg. = average, P16B = phase-shift resistivity measured by the EcoScope tool at a source-receiver spacing of 16 in (41 cm), A40B = attenuation resistivity measured by the EcoScope tool at a source-receiver spacing of 40 in (102 cm), RAB = resistivity-at-the-bit image obtained by the GeoVISION tool.

Previous | Close | Next | Top of page