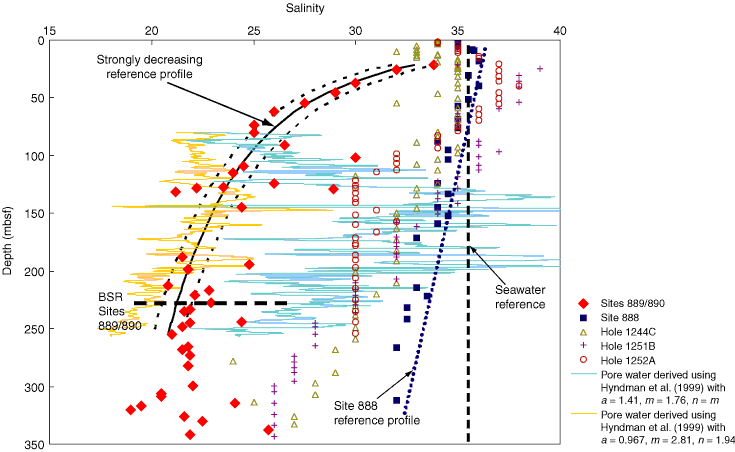
Figure F7. Pore water salinity of cores after gas hydrate dissociation from ODP Leg 146 Site 889/890 and deep-sea reference Site 888 and Leg 204 Sites 1244, 1251, and 1252. Data from Leg 204 were reported as integer numbers only. Solid black line is a reference assuming that the main trend with depth at Site 889 represents the in situ salinity and only the minor deviations are due to gas hydrate dissociation. The blue and yellow lines are estimates of in situ pore fluid salinity from the method of Hyndman et al. (1999) using different Archie's relations coefficients (from Riedel et al., 2005). BSR = bottom-simulating reflector.

Previous | Close | Next | Top of page