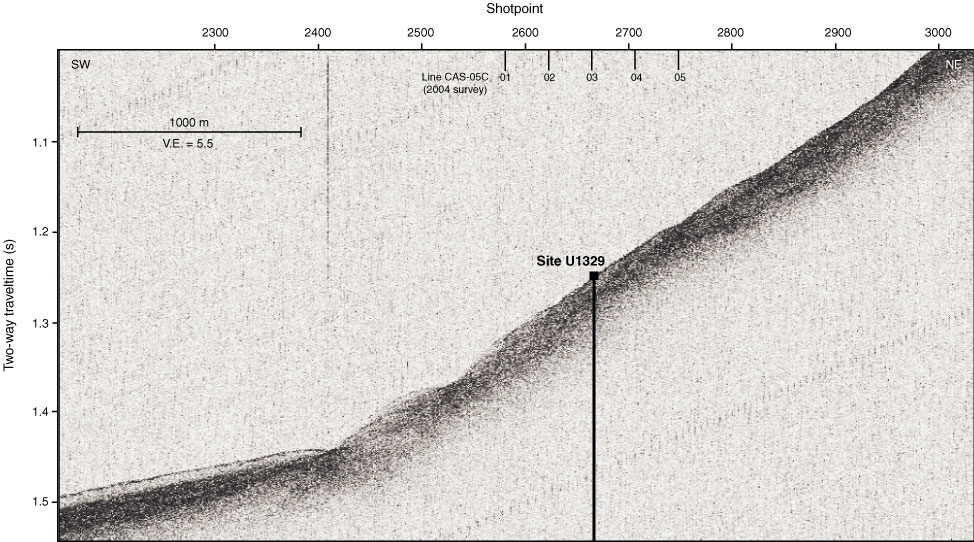
Figure F14. 3.5 kHz data along Line ODP-01 showing chaotic reflections on the steeper slope (Shotpoints 2400–3000), whereas the lower portion (Shotpoints 2200–2400) shows an abrupt change with seafloor-parallel sedimentation and the uppermost transparent Holocene reflector. V.E. = vertical exaggeration.
Previous | Close | Next | Top of page