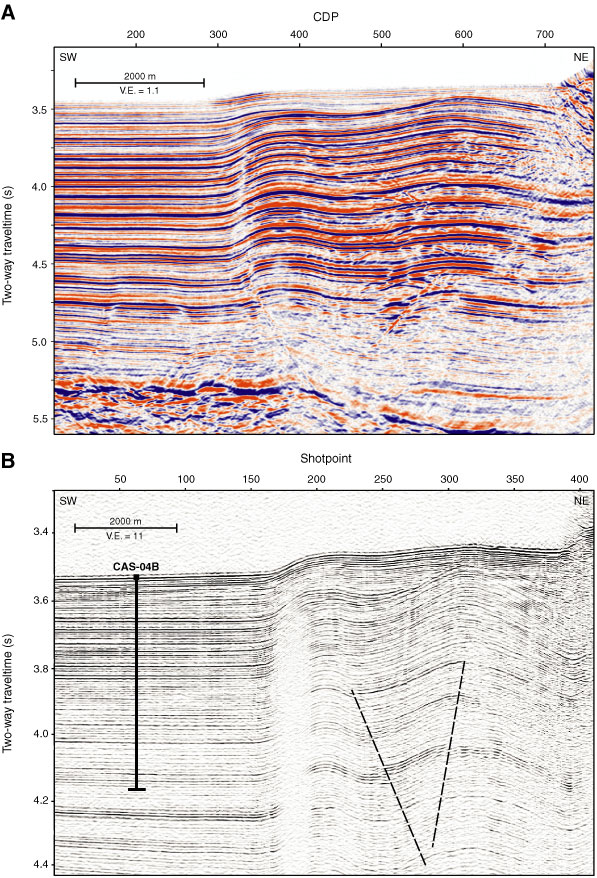
Figure F3. (A) Section of low-frequency MCS Line 89-08 over proposed Site CAS-04B, showing upper reflective turbidites and low-resistivity lower hemipelagic zone of the incoming turbidite sediment section west of the deformation front, and (B) coincident section of high-frequency MCS Line ODP-07 (COAMS data). The dashed lines identify faults that define a pop-up feature. CPD = common depth point, V.E. = vertical exaggeration.
Previous | Close | Next | Top of page