Previous | Close | Next
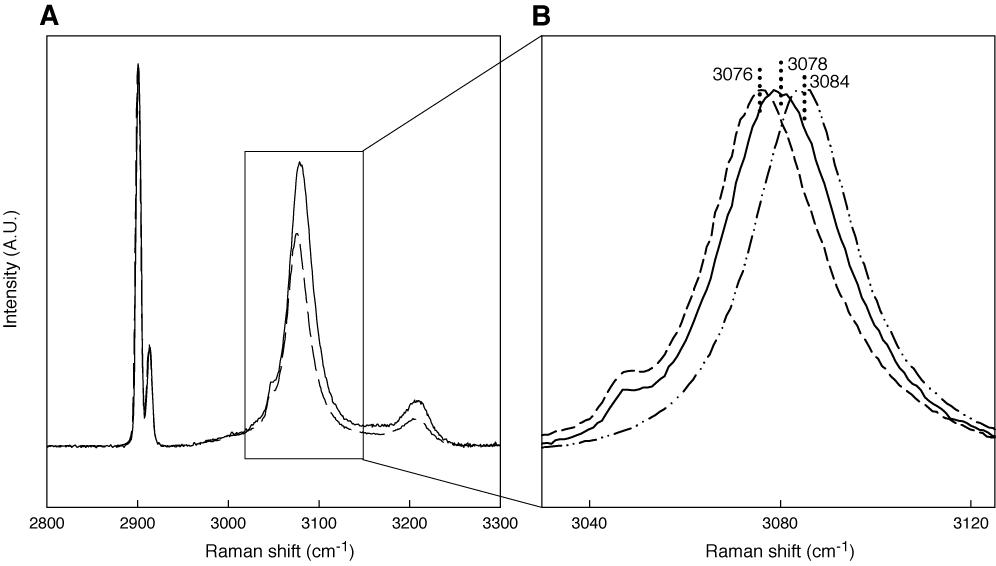
Figure F5. Raman spectra from Sample 311-U1328B-2H-HydCC (Sample H1). A. Two spectra normalized to methane peaks. B. Water stretching peak for two hydrate spectra and water ice.
Previous | Close | Next | Top of page