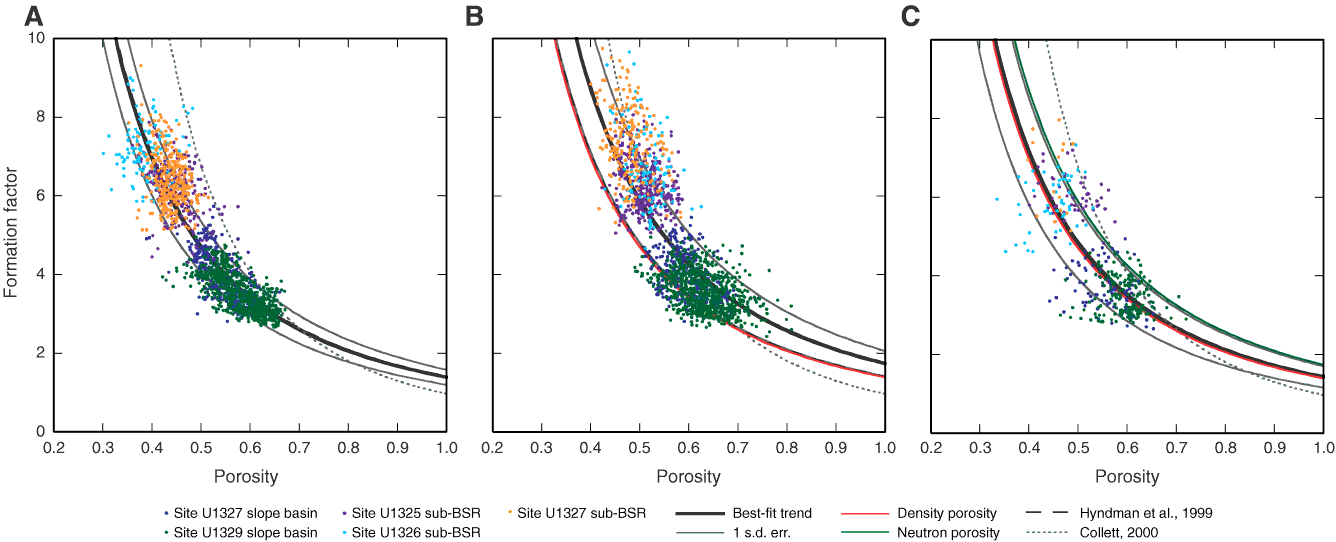
Figure F5. Formation factor vs. porosity (Pickett plot) for no-hydrate intervals of the well transect. Data points are taken from no-hydrate slope basin sediments and subbottom-simulating reflector (sub-BSR) zones. In all analyses, m was fixed to 1.76. A. Using density porosity yields a = 1.38 ± 0.18. B. Using neutron porosity yields a = 1.74 ± 0.32. C. Using core porosity yields a = 1.43 ± 0.27. For comparison, Hyndman et al. (1999) and Collett (2001) calculated Archie parameters of a = 1.41, m = 1.76, and a = 0.97, m = 2.81. s.d err. = standard deviation error.

Previous | Close | Next | Top of page