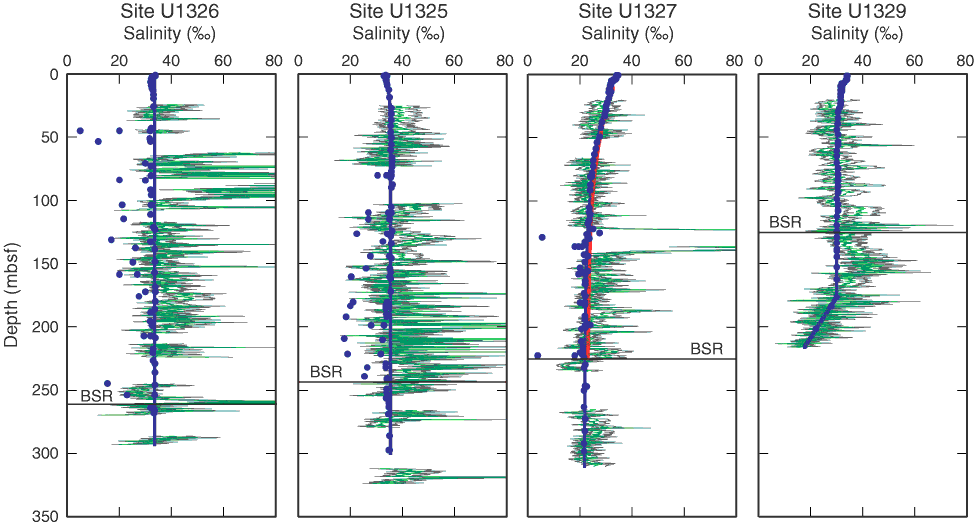
Figure F9. In situ pore water salinity concentration calculated from in situ salinity method, based on log density porosity. Green = calculated in situ salinity, gray = 1 σ error from the uncertainty in Archie parameter estimation, blue dots = core salinity measurements, blue line = core baseline salinity trend, red = reestimated in situ baseline salinity trend. BSR = bottom-simulating reflector.

Previous | Close | Next | Top of page