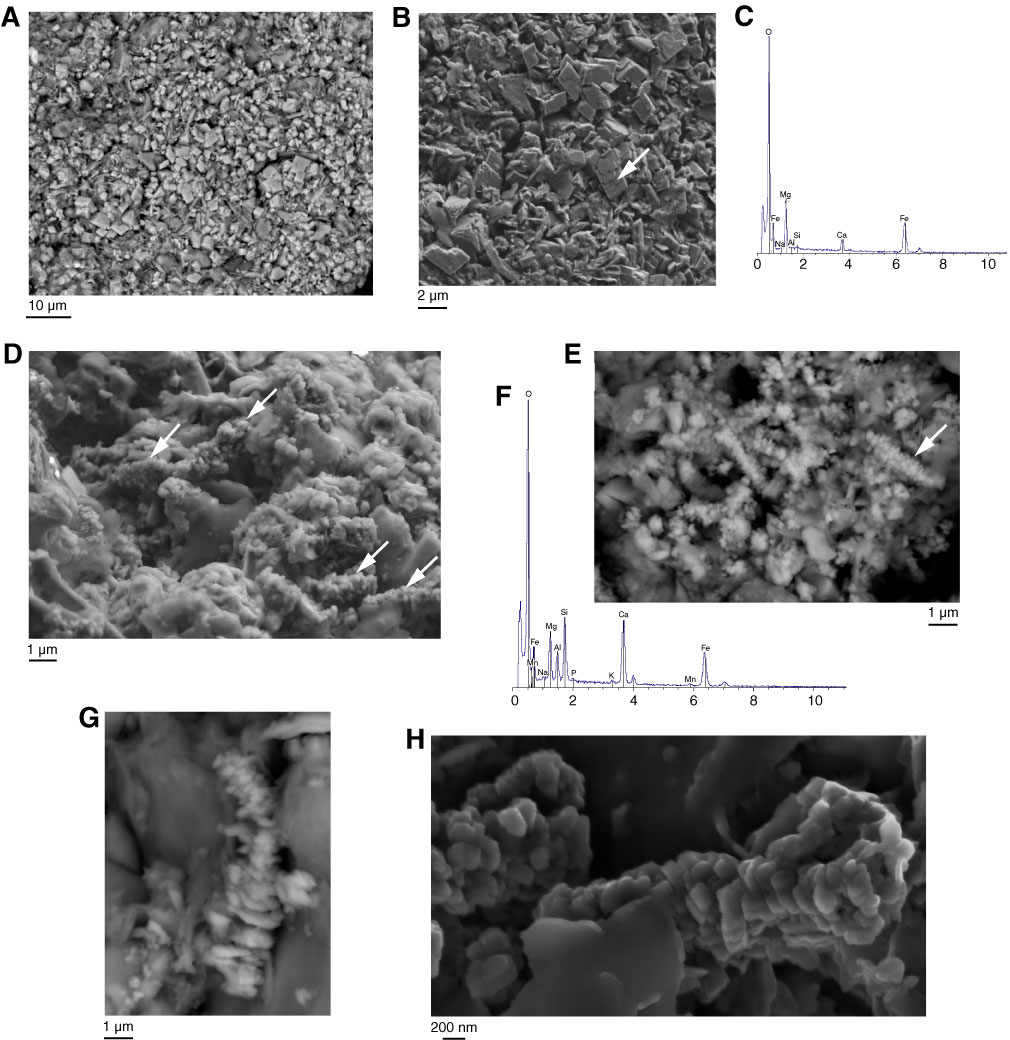
Figure F9. Scanning electron microscopy photographs of siderite and rhodochrosite authigenic facies. A. General view (backscattered electron [BSE]) of rhombohedra (1–4 μm) (Sample 311-U1329C-21X-3, 129–131 cm). B. Secondary electron (SE) detail view of A. C. Energy dispersive spectrometer (EDS) spectrum corresponding to an intermediate phase between magnesite, siderite, and calcite (see Mg, Fe, and Ca in EDS spectra). Corresponding XRD diagram appears indicate siderite with all peaks translated toward higher values (e.g., d104 ≈ 2.809 Å instead of 2.796 Å). D. SE photograph showing carbonates corresponding to thin areas (<1 μm; arrows) scattered in the detrital matrix (Sample 311-U1326D-20X-3, 0–1 cm). E. Dispersed fragments of sample in D observed on a glass slide (BSE). F. EDS spectrum of sample in E with Ca, Fe, Mg, and some Mn in the carbonates. G. Higher magnification of E showing aligned bladelike particles. H. Higher magnification of E showing rhombic crystals.
Previous | Close | Top of page