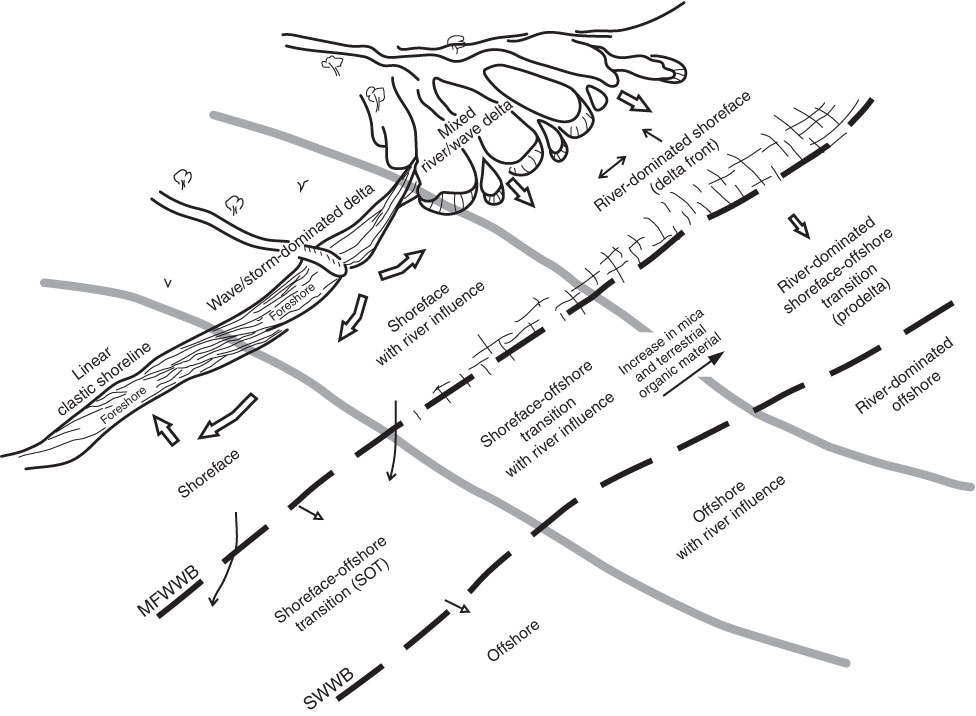
Figure F10. Diagram of main environments of deposition interpreted from facies descriptions used during Expedition 313. Diagram does not indicate along-shoreline variation at a point in time. Diagram shows more storm/wave–dominated coastal systems to the left and more river-dominated coastal systems to the right. Arrows indicate dominant direction and relative magnitude of sediment transport. MFWWB = mean fairweather wave base, SWWB = storm wave wave base.
Previous | Close | Next | Top of page