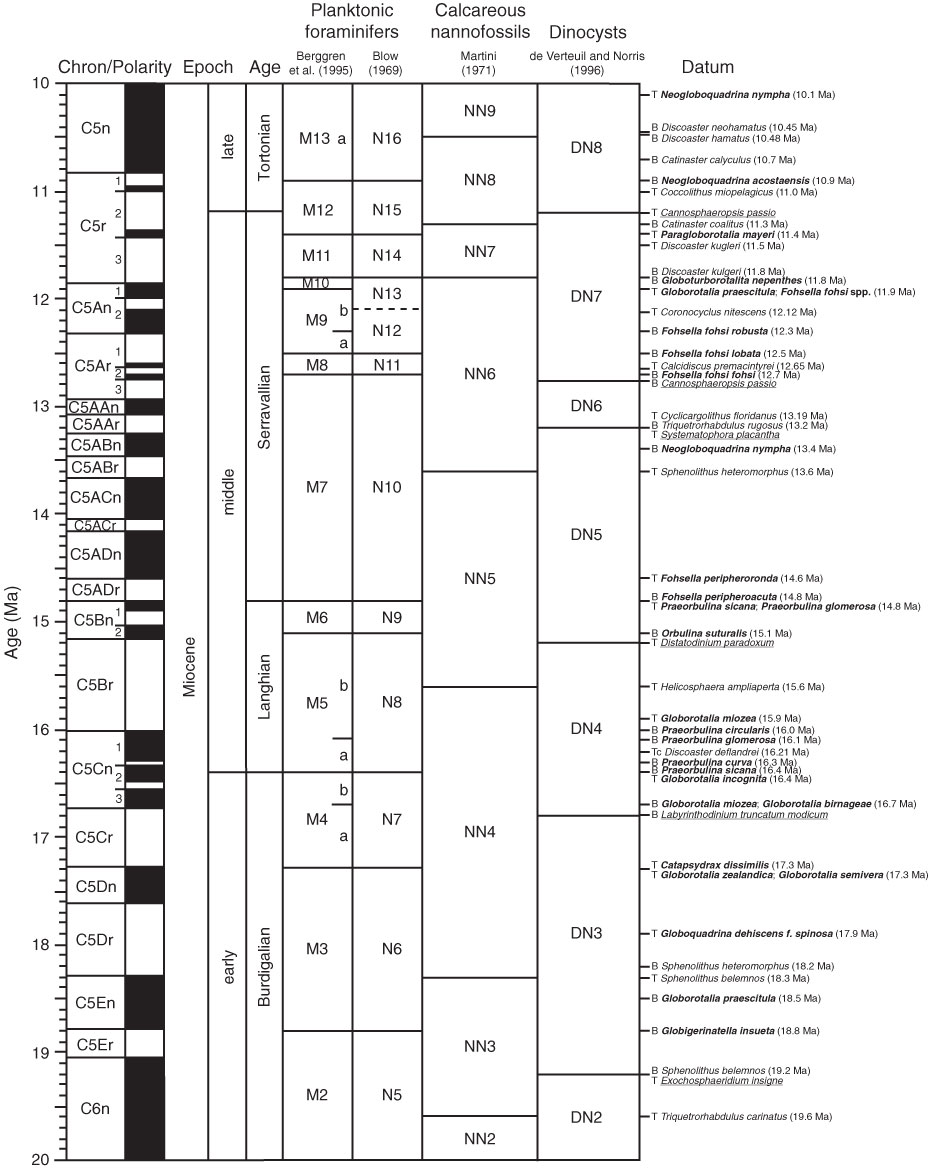
Figure F12. Correlation of geomagnetic polarity timescale (Cande and Kent, 1995), biostratigraphic zonations, and biohorizons used during Expedition 313. Bold text = planktonic foraminifers, plain text = calcareous nannofossils, underlined text = dinocysts. T = top, B = base, Tc = top common, X = abundance crossover. A. 10–20 Ma. (Continued on next page.)
Previous | Close | Next | Top of page