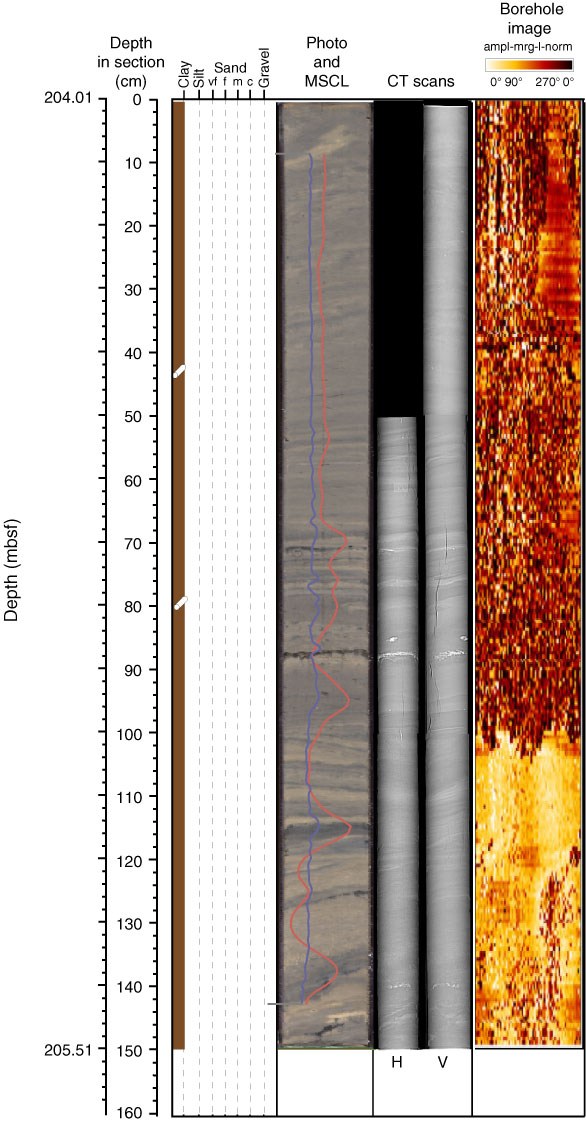
Figure F31. Two-dimensional computed tomography (CT) scan of Section 313-M0027A-69X-1 from Unit II shown with a line-scan image, magnetic susceptibility (red) and density (blue) from multisensor core logger (MSCL) measurements, and an acoustic image from the borehole. H = horizontal scan, V = vertical scan (see "Lithostratigraphy" in the "Methods" chapter). The lithology is predominantly clay, and laminae and thin beds are clearly expressed as a color contrast likely related to organic matter content. 0–50 cm: alternation of faint light and dark laminae, intensely bioturbated, expressed as relatively constant values in all data sets. 50–100 cm: millimeter-scale laminae are well expressed through density contrast in the CT image and also in oscillating values of bulk density from MSCL. Maxima of density occur in the dark beds found at 70.5 and 89 cm, which are very bright on the CT images and correspond to a high coefficient of attenuation. These layers may be defined by accumulation of heavy minerals. 100–150 cm: an abrupt contact is evident from the acoustic image around 100 cm in the core, with much paler color indicating a different sediment texture. vf = very fine, f = fine, m = medium, c = coarse. See Figure F1 for lithology legend.
Previous | Close | Next | Top of page