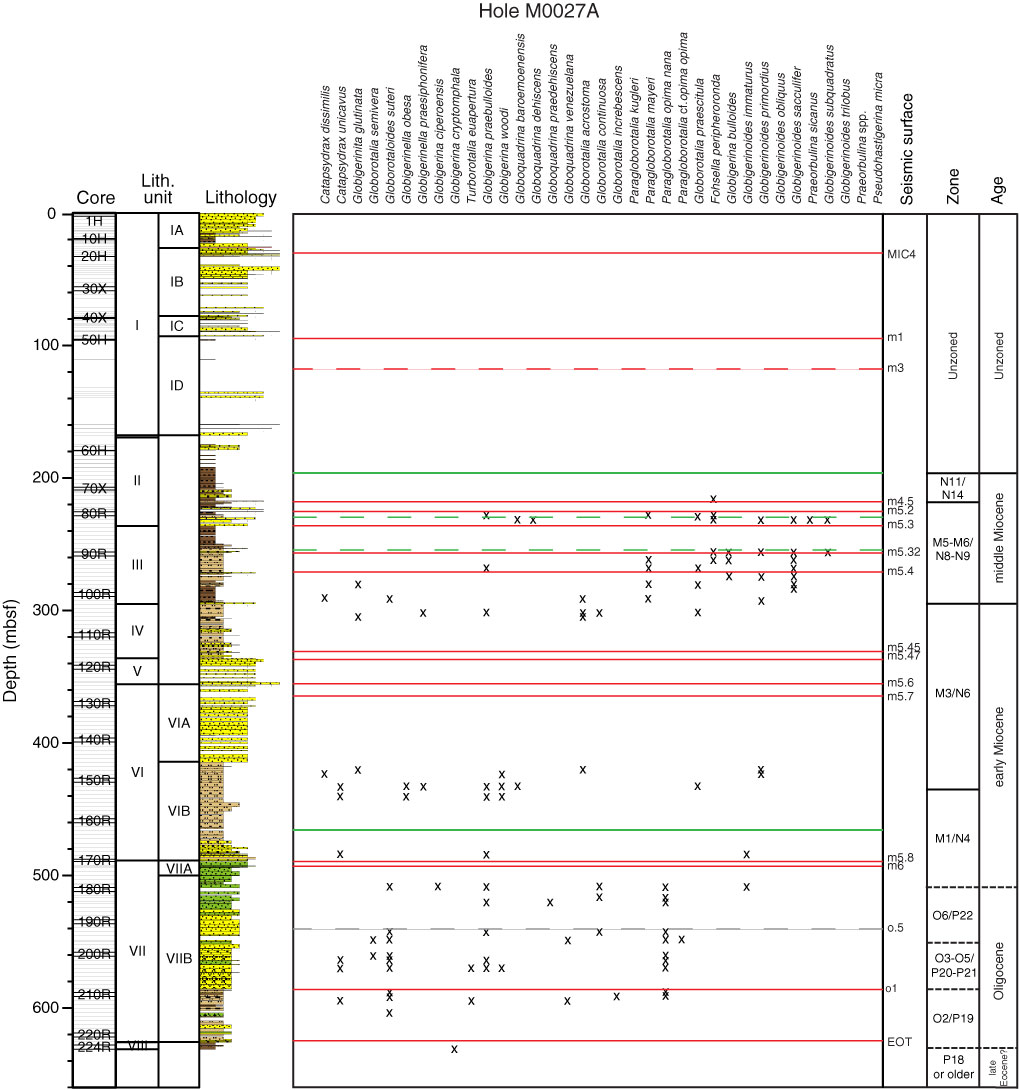
Figure F36. Planktonic foraminifer stratigraphic distributions in Hole M0027A. Red lines = sequence boundaries, green lines = major flooding surfaces. EOT = Eocene–Oligocene transition. MIC = marine isotope chron. See Figure F4 in the "Methods" chapter for lithology legend.
Previous | Close | Next | Top of page