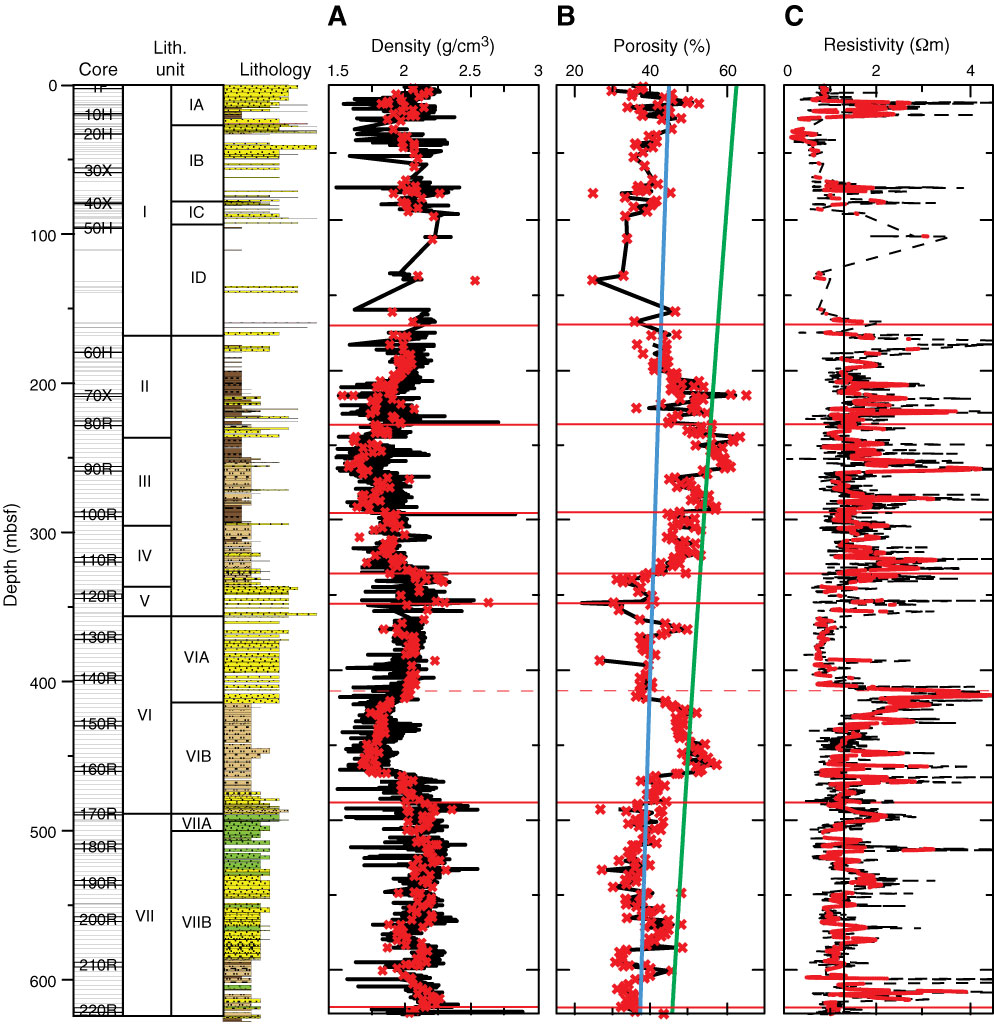
Figure F47. Gamma density and wet bulk density, porosity, and resistivity compared with lithology in Hole M0027A. A. Gamma density from the MSCL (black line) and wet bulk density from section samples (red crosses). B. Porosity from section samples (red crosses) and high-pass filtered porosity (black line). Mean porosity reduction of sands (blue line) and clay (green line) from global averages. Note how sands and muds in the top ~200 mbsf fall outside the trends, possibly because of dewatering during coring and handling. Eight density-porosity units correspond to variation in major lithology. C. Electrical resistivity. Back line = original data with section 3s removed (see text), red line = high-pass filtered record, vertical black line at 1.3 Ωm = average clay–silt resistivity with low-chlorinity pore water. Note lower resistivity in the top of the hole and between 344 m and 410 mbsf, bracketed by higher resistivity. Low resistivity corresponds to zones of high chlorinity (see "Geochemistry"). See Figure F4 in the "Methods" chapter for lithology legend.
Previous | Close | Next | Top of page