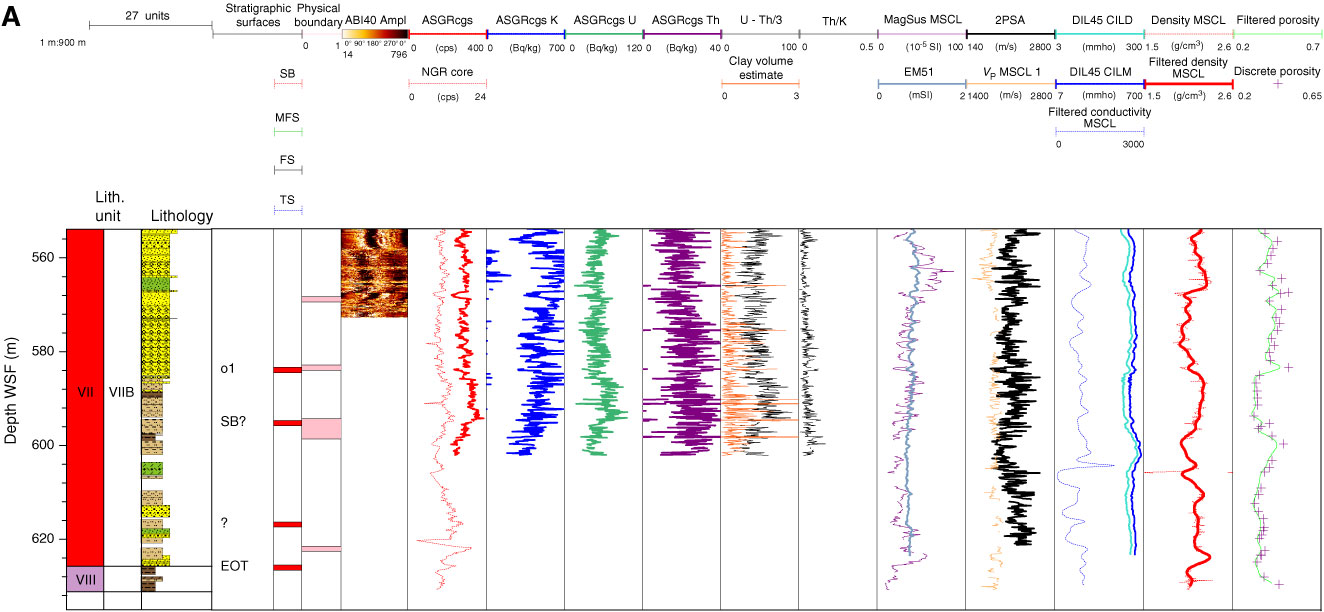
Figure F62. Detailed composite of selected downhole log data, petrophysical measurements, and derived calculations, Hole M0027A. Normalized amplitude acoustic image (ABI40 Ampl); acoustic caliper (AcCal); total gamma ray through pipe (ASGRcgs) and on cores (NGR core); potassium, uranium, and thorium contents (ASGRcgs K, U, and Th, respectively); U-Th/3 ratios; clay volume estimate; magnetic susceptibility from cores on the multisensor core logger (MagSus MSCL) and from downhole logging (EM51); P-wave velocities on core (VP MSCL) and from log (VP 2PSA); density from whole core (Density MSCL) and filtered signal; porosity from discrete measurements (porosity) and filtered signal; and impedance calculated from MSCL P-wave data (impedance MSCL) and sonic P-wave log (impedance 2PSA). Stratigraphic surfaces are added to the left: SB = sequence boundary, FS = flooding surface, MFS = maximum flooding surface, TS = transgressive surface. Petrophysical boundaries are shown in pink. EOT = Eocene–Oligocene transition. MIC = marine isotope chron. See text for discussion, Table T13 for boundary descriptions, and Figure F4 in the "Methods" chapter for lithology legend. A. 558–626 m WSF. (Continued on next four pages.)
Previous | Close | Next | Top of page