Previous | Close | Next
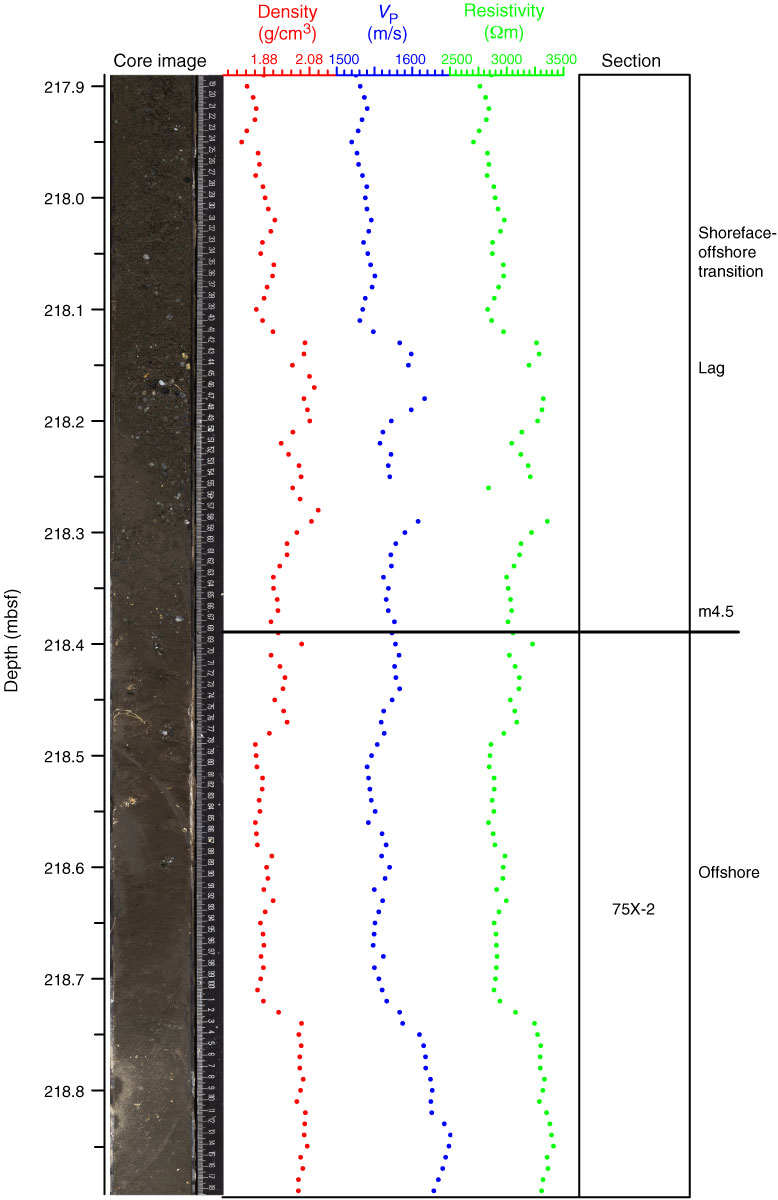
Figure F74. Correlation of core image with interpretation of deposition and age, density, P-wave velocity, and resistivity, 217.9–218.8 mbsf, Hole M0027A.
Previous | Close | Next | Top of page