Previous | Close | Next
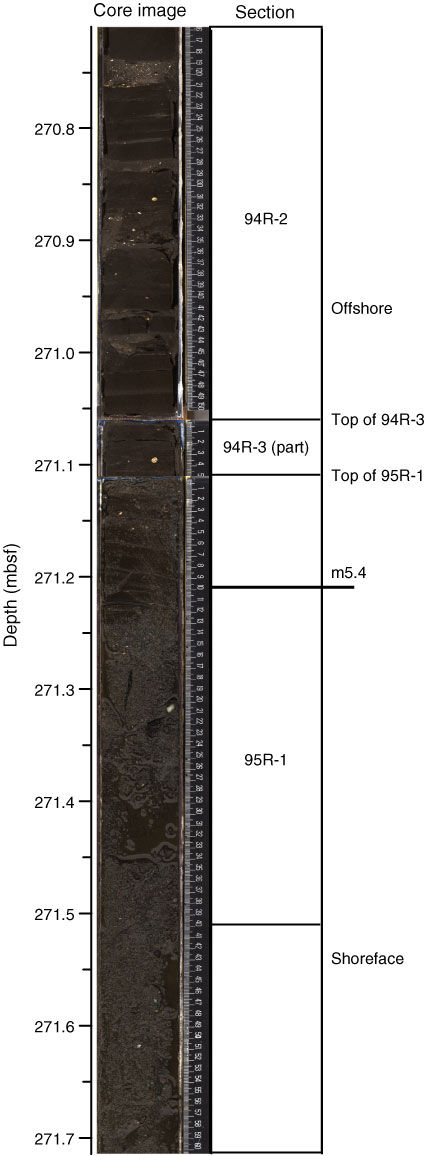
Figure F77. Correlation of core image with interpretation of deposition and age, 270.8–271.7 mbsf, Hole M0027A.
Previous | Close | Next | Top of page