Previous | Close | Next
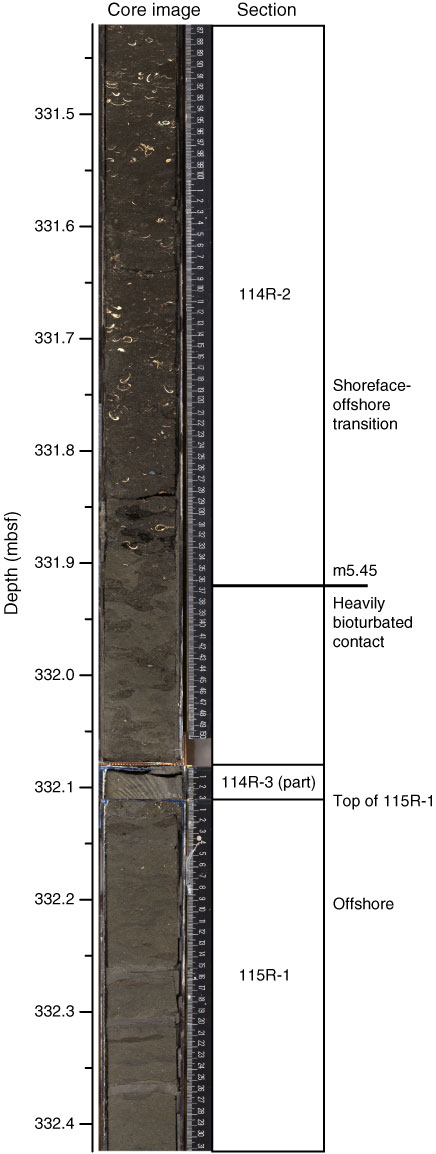
Figure F79. Correlation of core image with interpretation of deposition and age, 331.5–332.4 mbsf, Hole M0027A.
Previous | Close | Next | Top of page