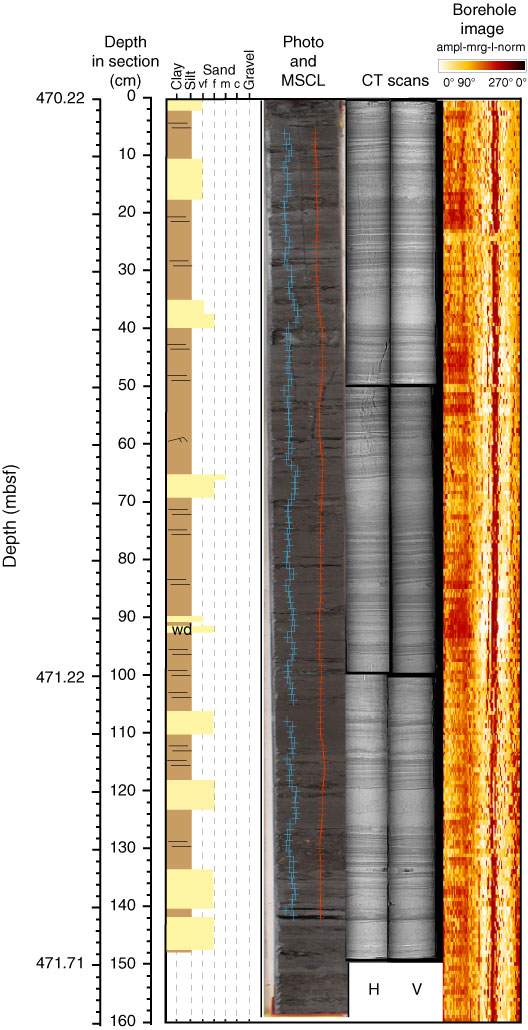
Figure F20. Archive-half line scan image, magnetic susceptibility (red), and density (blue) (from multisensor core logger [MSCL] measurements), with 2-D computed tomography (CT) scans of whole-core and borehole acoustic impedance images (Section 313-M0028A-97R-1). H = horizontal scan, V = vertical scan (see "Lithostratigraphy" in the "Methods" chapter). Subunit IIIC (Section 313-M0028A-97R-1) consists of very fine sandy silt and clay, very fine sand, and fine sand, in laminated and bioturbated interbeds. Plant debris is common; shell fragments are rare. Density and magnetic susceptibility from MSCL measurements show no significant oscillations, and the acoustic image appears homogeneous (slightly darker in intensely laminated areas). Visual description of core enabled the identification of alternating silt and sand layers. The thickest sandy beds are in agreement with visual core descriptions, whereas the millimeter-scale thin beds are only clearly distinguished on the CT digital images and not on visual core description. At least seven intervals between discrete sand beds can be identified. Each interval contains an 11–25 cm thick bed of fine-/very fine grained sand and slightly bioturbated laminae. Discrete accumulation of high-density (heavy?) minerals may correspond to the lightest gray laminae and individual white grains at 50, 88, and 132 cm. The presence of wood fragments, a low-density material, is evidenced by dark spots (see the dark laminae at 93 cm and the clast at 133 cm).
Previous | Close | Next | Top of page