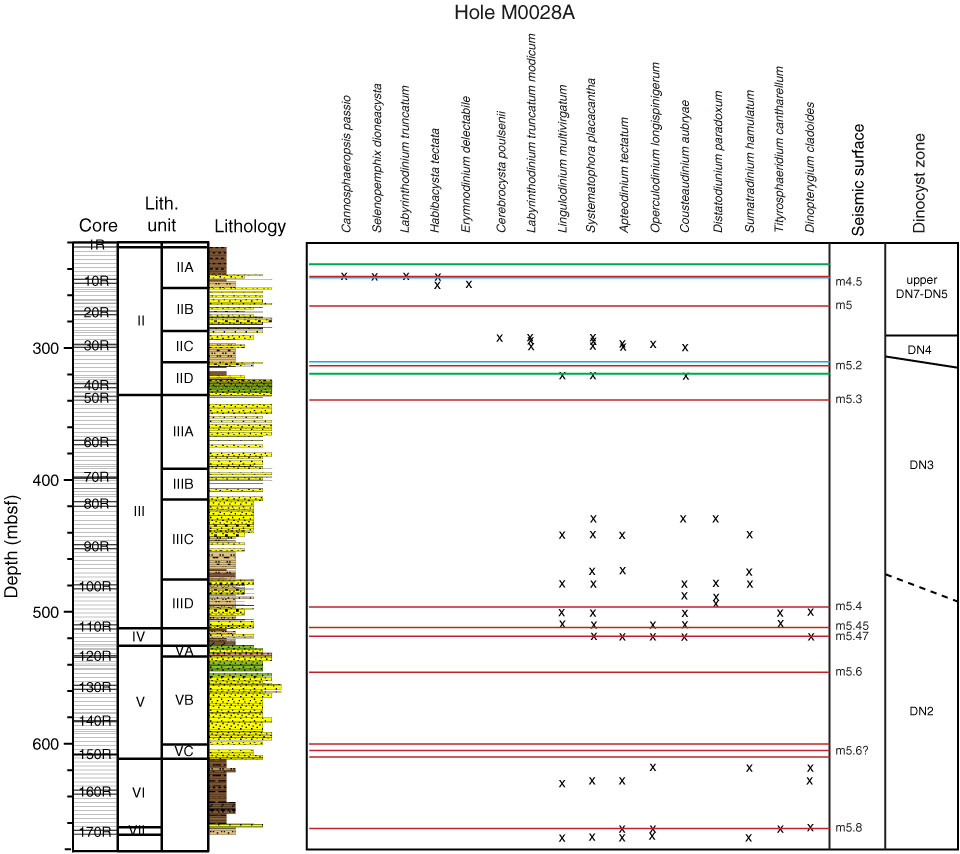
Figure F26. Stratigraphic distribution of age-diagnostic dinocyst taxa in Hole M0028A, with the Miocene zoned following de Verteuil and Norris (1996). Zone boundaries are drawn diagonally to indicate uncertainty in zonation between samples, because of either the absence of sampling between points or of age-diagnostic taxa. Red lines = sequence boundaries, green lines = major flooding surfaces, blue lines = transgressive surfaces. See Figure F4 in the "Methods" chapter for lithology legend.
Previous | Close | Next | Top of page