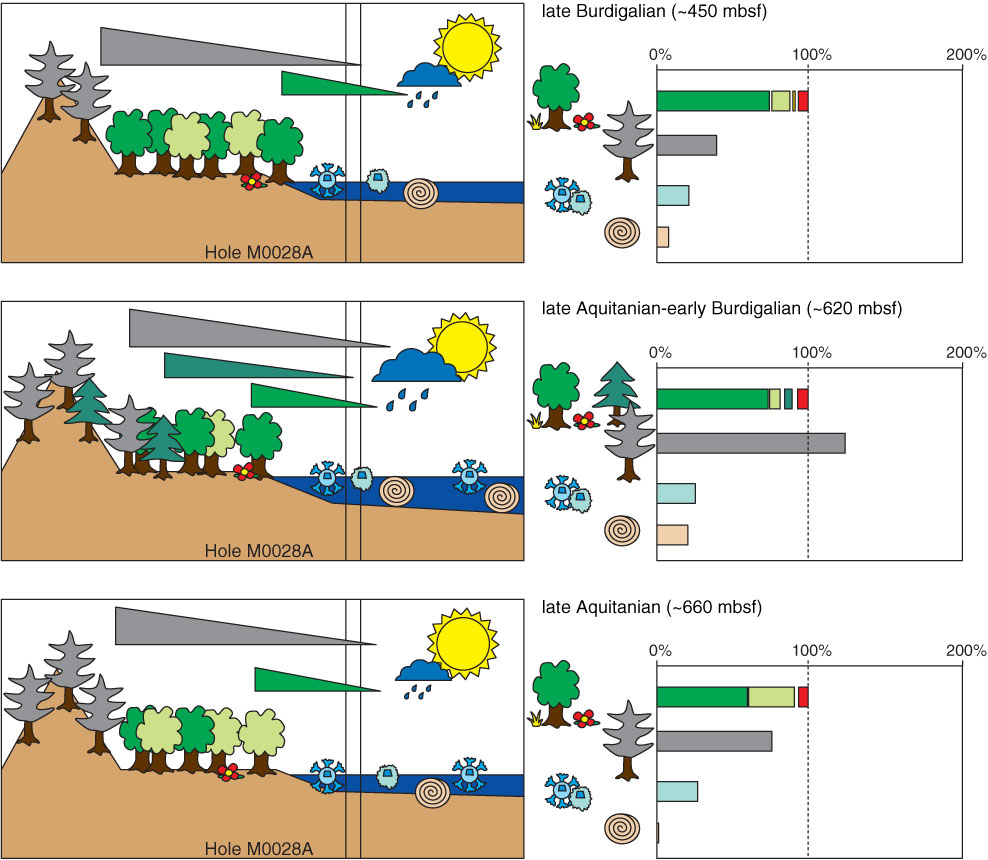
Figure F29. Simplified sketches based on terrestrial palynomorph sample analyses for Hole M0028A, showing hinterland and coastal ecology for the late Burdigalian to late Aquitanian. Gray trees = pines producing bisaccate pollen, green trees = trees producing nonsaccate pollen or pollen with small sacci. Blue-green conifers = hemlock, light green trees = hickory, dark green trees = other trees (mainly oak). Gray triangles = bisaccate pollen transport potential, green triangles = nonsaccate pollen transport potential. Blue-green triangle = transport potential of hemlock pollen (pollen with small sacci). Red flowers = herbs producing nonsaccate pollen, excluding monoporate pollen; yellow tussocks = grasses. Spirals = foraminifer test linings, cyan symbols = dinocysts. Size of yellow sun is proportional to estimated temperatures, size of rain cloud = moisture availability. Percentages of palynomorphs are displayed on the right. Reference sum is the total amount of nonsaccate pollen. Light green bars = hickory pollen, blue-green bars = hemlock pollen, dark green bars = pollen probably related to oaks and other broad-leaved trees, yellow bars = pollen of grasses (Poacea), red bars = herbal pollen. Gaps between green, red, and yellow bars = nonsaccate pollen that could not be assigned to the three main groups (pollen grains of aquatic plants, pollen filled with pyrite, and pollen of families containing both herbal and arboreal taxa).
Previous | Close | Next | Top of page