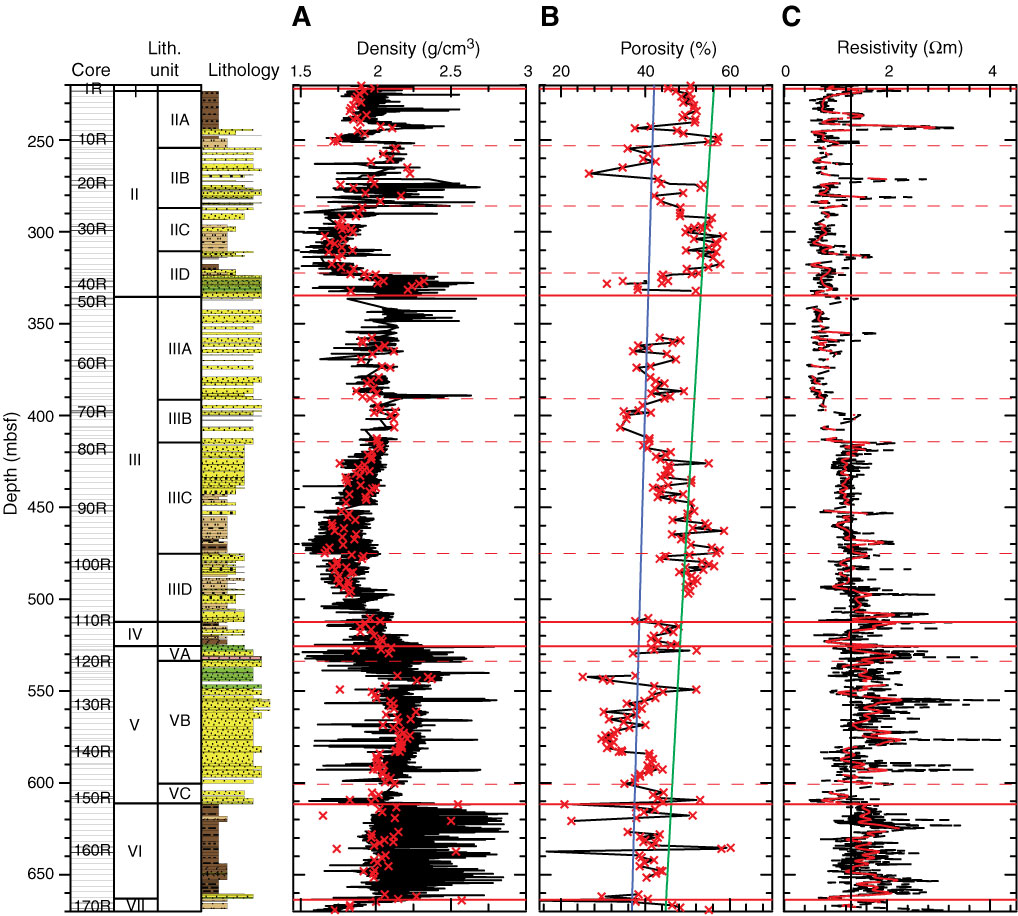
Figure F37. Gamma density, wet bulk density, porosity, and resistivity compared with lithology in Hole M0028A. A. Gamma density from the MSCL (black line) and wet bulk density from section samples (red crosses). B. Porosity from section samples (red crosses) and high-pass filtered porosity (black line). Mean porosity reduction of sands (blue line) and clay (green line) from global averages. C. Resistivity from MSCL. Black line = unfiltered, red line = filtered (see text), vertical black line at 1.3 Ωm = average clay–silt resistivity with low-chlorinity pore water. Note how porosity reduction in clay and silt-rich intervals follows reduction of global averages. See Figure F4 in the "Methods" chapter for lithology legend.
Previous | Close | Next | Top of page