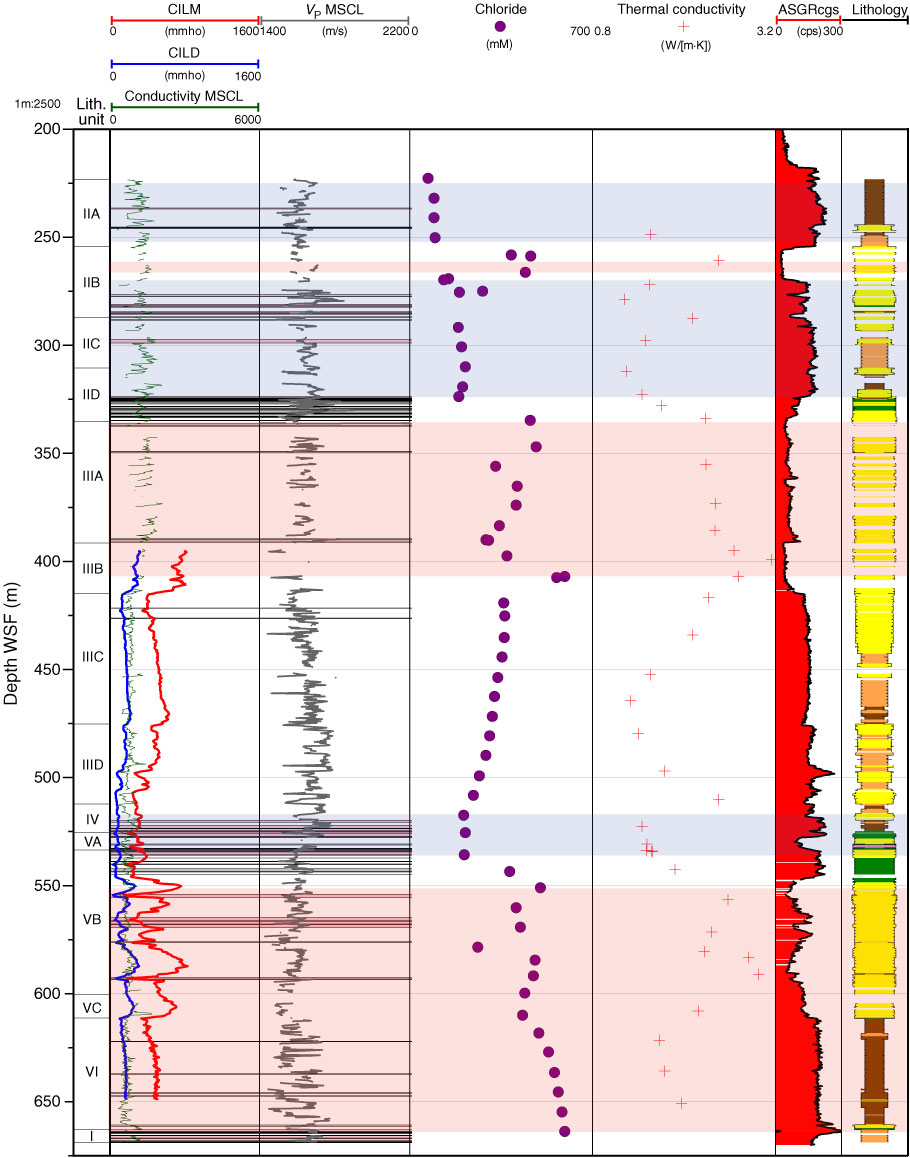
Figure F41. Total gamma ray (ASGRcgs), P-wave MSCL velocities, electrical conductivities (DIL45 and MSCL), chlorinity, and thermal conductivity, Hole M0028A. Cemented levels observed by sedimentologists are plotted as pink lines/bars across the P-wave and conductivity logs, which are anticipated to show an increase and decrease, respectively, at most of these horizons. Pink and blue shading shows intervals of high salinity and freshwater, respectively (see "Geochemistry"). See Figure F1 for lithology legend.
Previous | Close | Next | Top of page