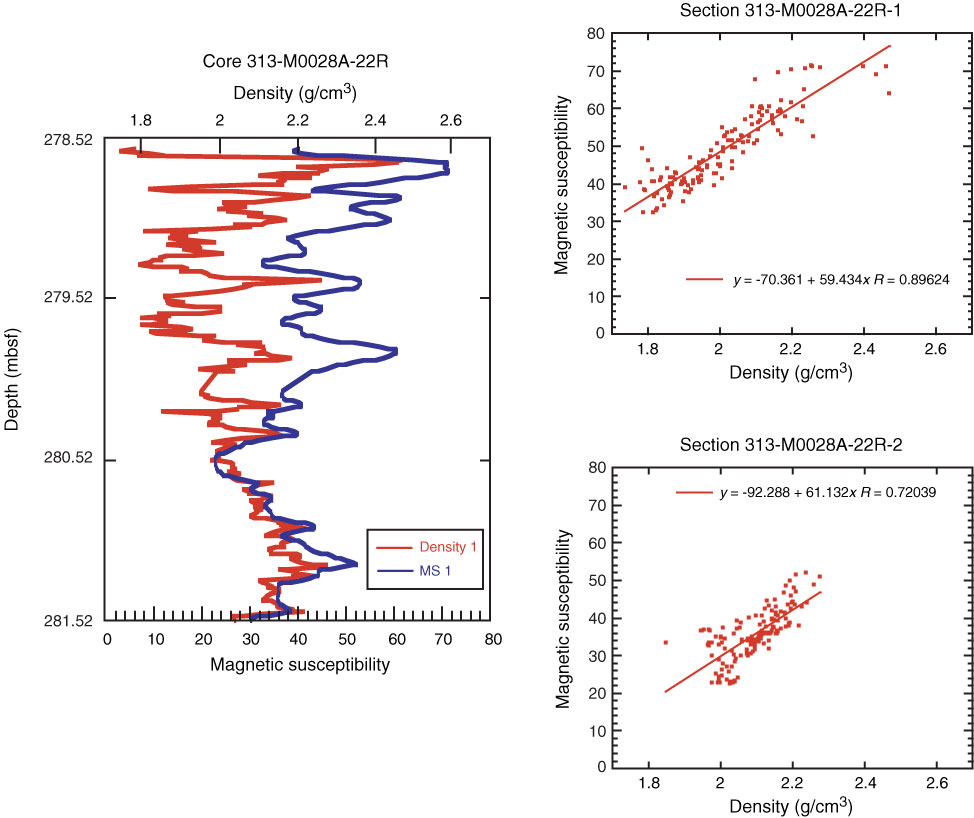
Figure F43. Example of linear correlation between density (red curve) and magnetic susceptibility (MS; blue curve), Sections 313-M0028A-22R-1 and 22R-2. Linear correlation is probably caused by the concentration of mature glauconite (density of 2.9 g/cm3 and high iron content) in the sediments.
Previous | Close | Next | Top of page