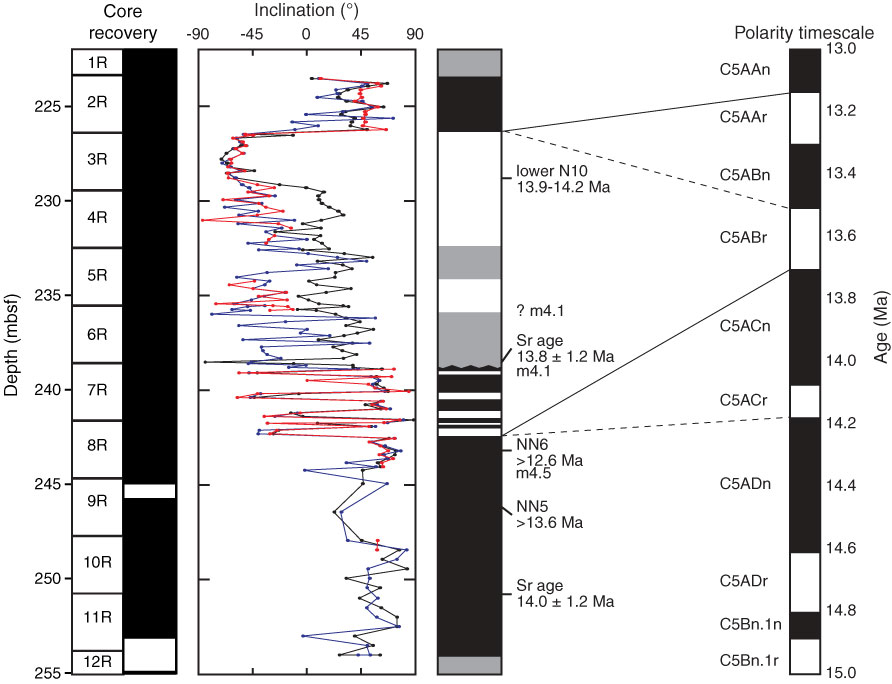
Figure F47. Preliminary magnetostratigraphic interpretation, Cores 313-M0028A-2R through 12R. Inclination data of initial NRM (black) and at 30 mT (blue) and of ChRM (red) derived by PCA analyses where applicable. Magnetic polarity timescale from Cande and Kent (1995). Preliminary tie points: solid line = interpretation A, dashed line = interpretation B.
Previous | Close | Next | Top of page